Introduction
This article aims to guide non-profit organizations in understanding the significance of monitoring and analyzing email campaign results, emphasizing the role of data-driven insights in optimizing future campaigns for increased engagement and support toward their mission. CharityEngine offers a host of reporting to assist non-profits in monitoring campaign results.
Table of Contents
- Introduction
- Unveiling Success: The Art of Monitoring Results in Non-Profit Campaigns
- Leveraging CharityEngine Marketing Analytics
- Taking Action on Initiative Analytics
- Investigating Failed Email Delivery
- Instructions: How to identify failed emails via Initiatives Listing Screen
- Instructions: How to read the Send Failures Report
- Resource: Blacklist and Suppression - Defined
- ROI: Initiative & Segment Costs
- FAQ & Further Reading
Unveiling Success: The Art of Monitoring Results in Non-Profit Campaigns
In the realm of non-profit organizations, marketing serves as a potent tool for engagement, fundraising, and raising awareness for critical causes. While crafting compelling email content is pivotal, equally crucial is the process of monitoring and analyzing campaign results. Here’s a comprehensive guide to understanding and leveraging data to optimize non-profit email campaigns effectively.
Importance of Monitoring Email Campaigns
Email marketing offers a treasure trove of valuable insights. Monitoring campaign results provides non-profits with data-driven feedback, allowing them to understand recipient behavior, preferences, and the effectiveness of their messaging. It's a fundamental step toward optimizing future campaigns and maximizing impact.
Key Metrics to Monitor
Several key performance indicators (KPIs) are essential for evaluating the success of non-profit email campaigns:
- Open Rates: Measure the percentage of recipients who opened your email. It reflects the initial interest and engagement.
- Click-Through Rates (CTRs): Track the percentage of recipients who clicked on links within your email. It indicates the effectiveness of your call-to-action.
- Conversion Rates: Measure the percentage of recipients who completed the desired action, such as making a donation or signing a petition.
- Unsubscribe Rates: Monitor the rate at which recipients opt out of your email list, indicating disengagement or dissatisfaction.
Tools for Tracking and Analysis
Utilize email marketing software or analytics platforms to track and analyze campaign performance. These tools provide detailed insights into email metrics, recipient behavior, segmentation effectiveness, and audience engagement patterns.
Understand and Interpret Data
Once you've gathered data, delve deeper into understanding what the numbers signify. Analyze trends, identify patterns, and draw correlations between different metrics. For instance, high open rates but low click-through rates might indicate a discrepancy between subject lines and content relevance.
Adjust and Optimize Strategies
Based on insights gained from data analysis, optimize future campaigns. Experiment with different subject lines, content formats, CTAs, sending times, or audience segmentation strategies. Implement A/B testing to refine elements and improve engagement.
Long-term Relationship Building
Email monitoring isn't just about analyzing campaign performance; it's about building lasting relationships. Use data insights to segment your audience effectively and deliver tailored content that resonates with their interests and preferences. Continuously refine your strategies to foster deeper connections.
Continuous Improvement and Learning
Treat every email campaign as a learning opportunity. Embrace a mindset of continuous improvement by consistently reviewing data, analyzing results, and applying insights gained to enhance future campaigns. Be adaptable and open to refining strategies based on evolving audience behavior and preferences.
Conclusion
Monitoring and analyzing results from non-profit email campaigns play a pivotal role in driving success. By keeping a keen eye on key metrics, understanding data insights, adjusting strategies, nurturing relationships, and embracing a culture of continuous improvement, non-profits can optimize their email marketing efforts for greater engagement and impact.
Remember, the true power lies not just in sending emails but in deciphering the data they yield to create meaningful change for the causes you champion.
Leveraging CharityEngine Marketing Analytics
After an email has been sent, it is always important to check the email analytics to view how well the email performed. By viewing this information, you can gain knowledge on what works and what does not when it comes to sending emails. The most important data to look at is the delivery rate, the conversion rate, the opt-outs, and the actual audience size.
While this article will provide detailed assessment on an individual initiative, there are additional reports available through the Reports & Analytics Campaign section which can provide a user with a higher level overall email delivery performance.
Note:
- While the following is informational, we recommend reviewing an email initiative within your account to evaluate the results.
- The following article provides user guidance on individual initiative analytics. Additional reports are available through the Reports & Analytics App > Campaigns. Reports such as Email Deliverability will provide a higher level email performance dashboard. While more detailed reporting and trends on send failures, mail bounces, spam complaints, and email list health.
How to access email initiative analytics

-
-
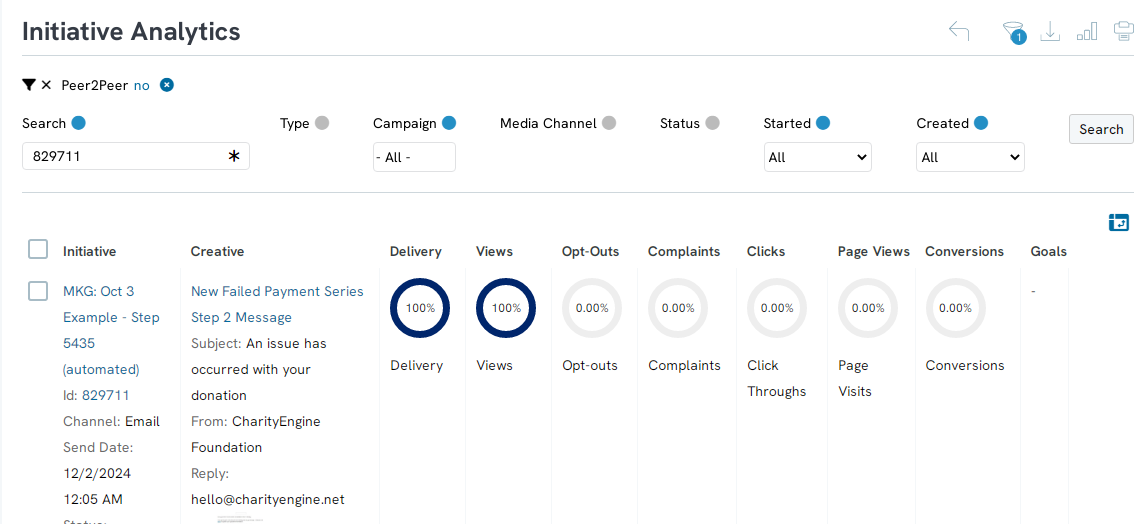
- Analytics presented on the left represent data sets in creating and launching of the email initiative - this includes the unique identifier, the audience, sending dates and status.
- The Audience detail can demonstrate to the user the number of initial audience segment and those who were suppressed due to opt out, duplicates, deceased, inactive contacts, blacklisted counts. These are important elements when determining the variance from the initial audience source count vs. the final deliverable audience count.
- Analytics presented on the right represent data points following the email delivery to email service providers. This can include delivery rates, views, clicks, and conversions (financial engagement). Hovering over each percentage will expose additional data points with available click through for contact details and analysis.
- Analytics presented on the left represent data sets in creating and launching of the email initiative - this includes the unique identifier, the audience, sending dates and status.
-
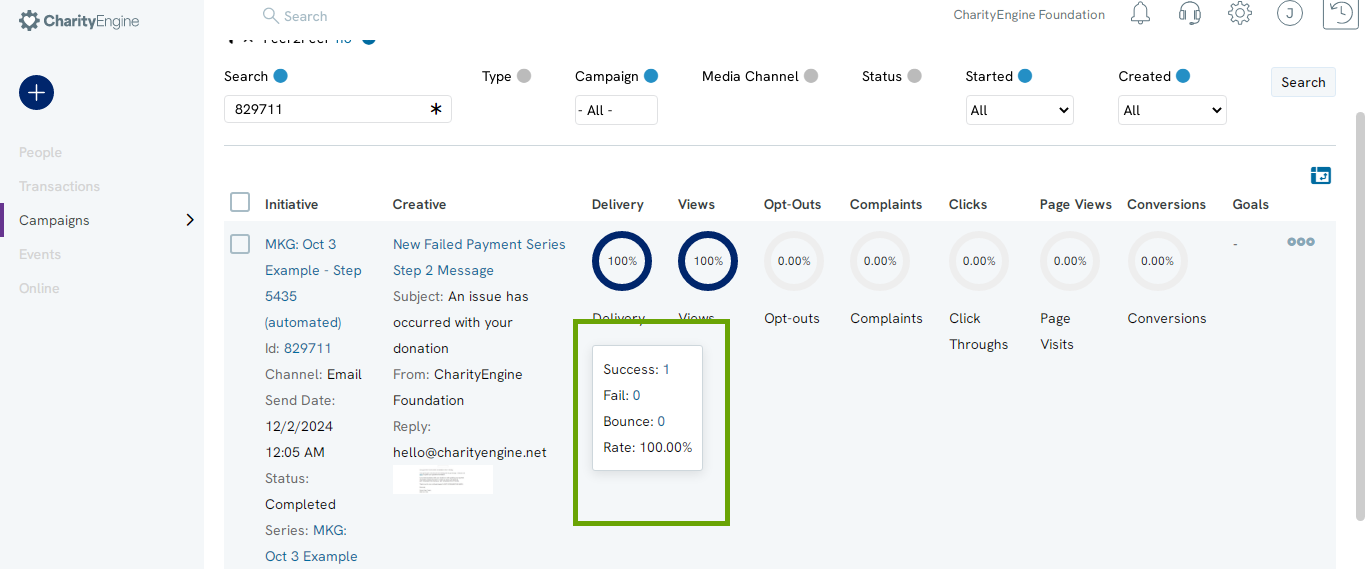
Note: By navigating over any of the percentage values, you can expose reporting details. All values in blue will allow the user to click through to evaluate specific data points.
Step 8: Opt-outs will allow you to quickly view all users who had opted out at the contact level and/or the individual email address.
Taking Action on Initiative Analytics
As a bulk sender, list management and cleansing is an important aspect to ensuring successful delivery to email inboxes. CharityEngine offers several reporting tools to assist users with analysis and information to take action on email sending practices. Below are a few examples of reports and suggested actions.
To access the portfolio of reporting, navigate to the Reports & Analytics App > Campaigns section for these and more...
Audience/List Management
- Audience: Review contacts across various email status (via quick filter). This is a great report for audience list cleansing activities. Easily sort for invalid contact records, duplicates, deceased records, inactive records. As a bulk sending, cleansing sending lists will provide the user with improved audience member counts. Note, CharityEngine will complete cleansing at each initiated email send to ensure the sender is in compliance with CAN-SPAM Act requirements, including suppression of sends to blacklisted emails, spam complaint opt outs, and individual opt out requests.
- Recipients: Review individual initiatives to see an audience itemized view of engagement and actions.
- List Unsubscribe: Review users who have unsubscribed. While CharityEngine will suppress, the sending organization should also consider cleansing lists and removal of unsubscribed users. Doing so will provide the user with a more accurate listing of audience counts.
- Spam Complaints: Evaluate where users reported to their ESP that the email was spam. These can have negative impact to a bulk sender's reputation. Industry rates should remain under 0.01%. If a bulk sender is exceeding these rates, please evaluate sending practices. Evaluate target audience and creative/subject content which may be triggering the audience to report the email as spam.
- Outbound Messages: Quickly assess total initiative sends by month - determining if users may be experience email fatigue which may result in higher spam complaints or email opt out.
Email Engagement
- Landing Pages & Links: Evaluate how audience members are interacting within one or more initiatives. Data can provide users with insights on where and what frequency in which audience members click on embedded links.
- Email Message Heat Map: (Note: located under Email section) This provides the user with a visual representation of a selected email to see where users are clicking and navigating most frequently.
- Initiative Actions: View a listing of individual audience actions to evaluate views, conversions, click throughs
Investigating Failed Email Delivery
While failed emails may be unavoidable when sending an email initiative, it is important to investigate why the email failed. Understanding email failures will assist in greater deliverability rates, improve sending rates, and most importantly the ability to ensure you are reaching your donors.
Instructions: How to identify failed emails via Initiatives Listing Screen
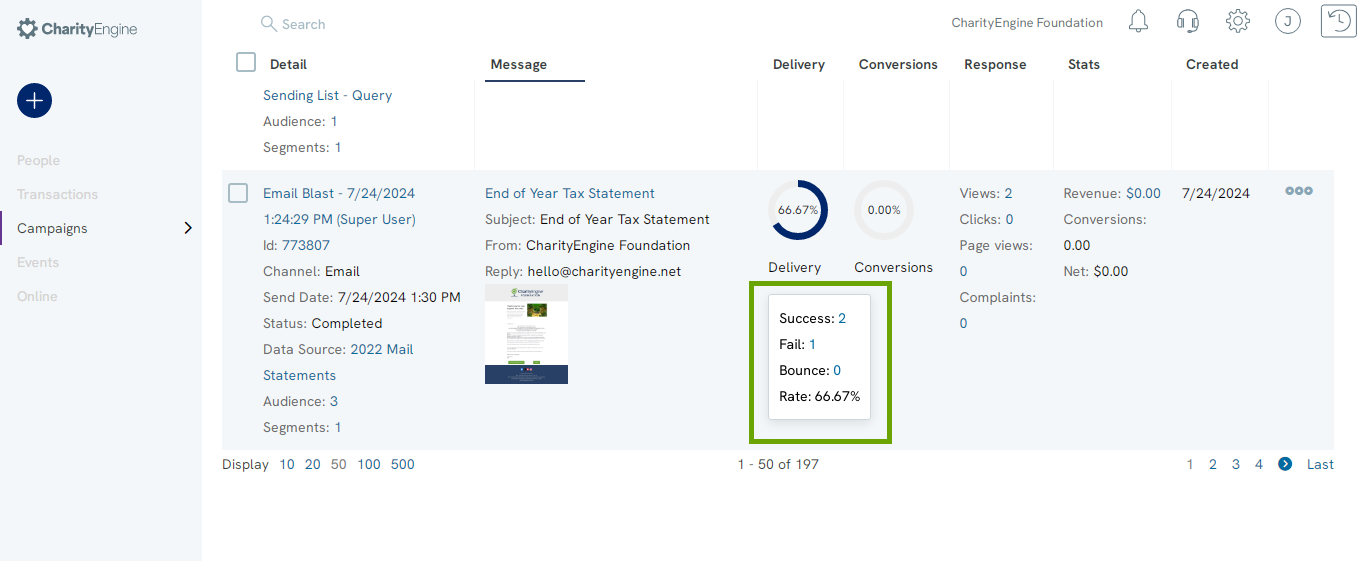
Step 1: Navigate to the Campaigns App > Create & Publish > Initiatives > locate the email initiative you wish to review.

Step 2: Navigate to click on the number next to Fail and you will be redirected to a Send Failures summary.
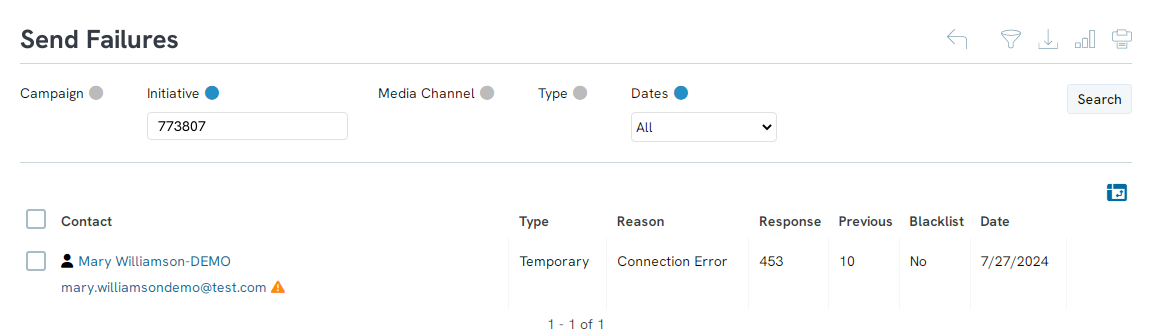
You will be navigated to the fail analytics page and will be able to view why the email failed to send. In the below example, there was a Connection error, 10 previous fails, and the contact was not blacklisted.
Instructions: How to read the Send Failures Report
Step 1: Review the REASON code to determine why the email failed to send to the Email Service Provider (ESP). Reason detail can be found here within the Bounce and Failure Code Quick Reference Guide
|
Failure Codes |
|
|
Fail Message |
Definition |
|
DNS Error |
Error communicating to the given email provider or if the recipient’s IT systems (specifically their DNS servers) are not working properly. |
|
Connection Error |
Error connecting to a mail server. This happens when mail servers are down or are overloaded and are not accepting any emails. |
|
Response Error |
This fail message is displayed when an email server returns an error message. This can happen if a recipient’s mailbox is full or if there are potential IT issues and/or errors on the client's end. |
|
SSL Authentication Error |
This failure message occurs when there are IT issues indicating that the client's IP address isn’t being seen as secure on the recipient's end. |
|
Suppression Error |
This error is when an email server informs users that an email address is suppressed. Suppressions occur when an email provider communicates that the email is invalid or has reported the sender as spam. |
|
Bad Data Error |
This failure is displayed when an email address is invalid. This occurs when incorrect is data associated with the intended email recipient. This could be anything from a fake domain used (i.e. ABC@123.com) or if an email address ported into the system contains items such as two "@" signs. |
Resource: Blacklist and Suppression - Defined
CharityEngine will blacklist emails after certain events to ensure that the sender continues to have the best reputation possible with email providers. While it is not recommended, customers can request to have an email address removed from the CharityEngine blacklist.
It is important to note that there are two blacklists – one that is maintained within the customer’s CharityEngine that a specific to the send history between the customer and receiving email since being in CharityEngine. In addition to the customer blacklist, there is a global blacklist that is utilized across all customers. Often the fails listed as Suppression Error are emails that are listed in CharityEngine’s global blacklist.
Resource: Bounces - Defined
A bounce is when you receive a response as to why your message was not able to be delivered. This is similar to when you receive a letter back that says “return to sender” on the envelope.
|
Undeliverable Bounces |
|
|
Bounce Reason |
Definition |
|
Soft |
Your message encountered an error and was not delivered. Future messages to this recipient may succeed. (i.e. mailbox full, account disabled, exceeds quota, out of disk space, relaying denied) |
|
Hard |
Your message encountered an error and was not delivered. Future messages to this recipient will fail. (i.e. user unknown, mailbox not found, etc...) |
|
Block Bounces |
|
|
Bounce Reason |
Definition |
|
Challenge |
Your message was blocked and further action is necessary to deliver your message. Typically these bounces are sent from spam filters that have quarantined your message, but will deliver it if you follow the instructions in the bounce. |
Complaints |
Your message was blocked as user reported spam or unsubscribe through Email Service Provider. |
| ESP Bad Data |
Your message was blocked due to invalid data response from ESP (email service provider). |
| Excessive |
Your message was blocked due to attempts exceeded maximum failures of any type and have had no successful sends. |
|
Permanent |
Your message was blocked due to attempts exceeded maximum failures and have had no successful sends. |
|
Spam |
Your message has been identified as spam and was blocked. |
|
Virus |
Your message contained a virus and was blocked. |
|
Other |
Your message was blocked for an unknown or general reason. |
|
Informational Bounces |
|
|
Bounce Reason |
Definition |
|
Transient |
Your message encountered an error, but the error condition may be temporary and delivery attempts are still being made. (i.e. unable to connect to recipient's mail server) |
|
Auto-reply |
The bounce is an auto-reply. (i.e. out of office, vacation) |
|
Subscribe |
The bounce is a subscribe request. (i.e. someone wants to join a mailing list) |
|
Unsubscribe |
The bounce is an unsubscribe request. (i.e. someone wants to be taken off of a mailing list) |
|
Address Change |
The bounce is an address change notification. |
|
Modified |
Your message was modified prior to delivery. (i.e. illegal attachment removed |
ROI: Initiative & Segment Costs
Return on Investment (ROI) is a crucial metric that evaluates the effectiveness and success of marketing efforts in generating value and impact for non-profit organizations. While the primary aim of non-profits isn’t financial gain, measuring ROI helps in assessing the efficiency of resources allocated to marketing campaigns and initiatives. CharityEngine allow users to enter campaign costs to allow for calculated ROI as donations are received.
To establish goals and costs, follow these steps:
Step 1: Navigate to the Campaigns App > Create & Publish > Initiatives > locate the associated initiative > ACTIONS >
Step 2: Access the Goals tab to assign a financial/conversion goal and/or a conversion goal
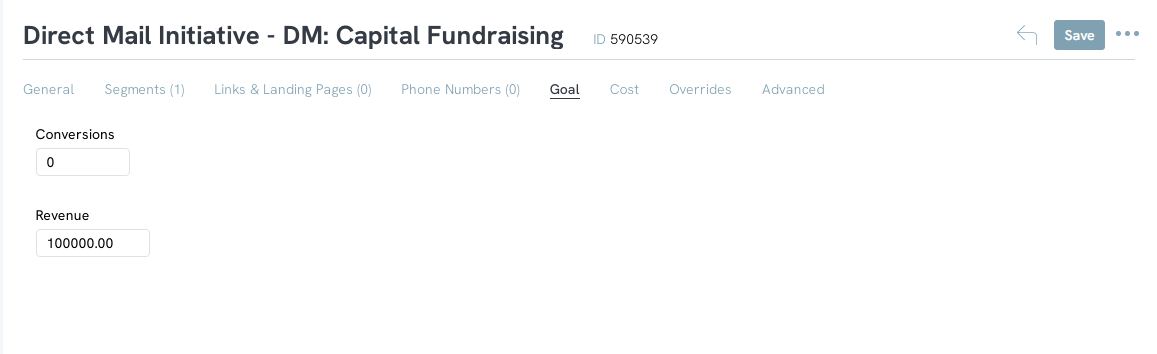
Step 3: Access the Cost tab to assign as Fixed Cost, Per Message Cost, and/or a Delivery Per Message rate
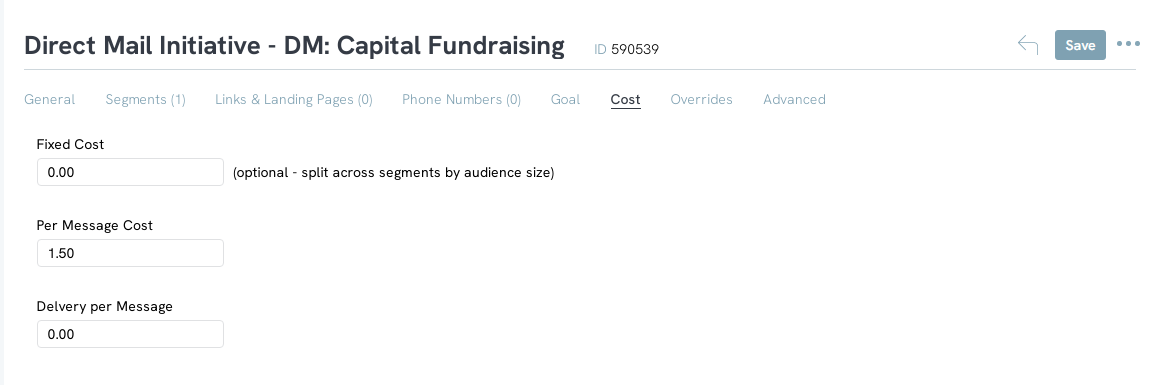
Step 4: Click SAVE to secure all changes
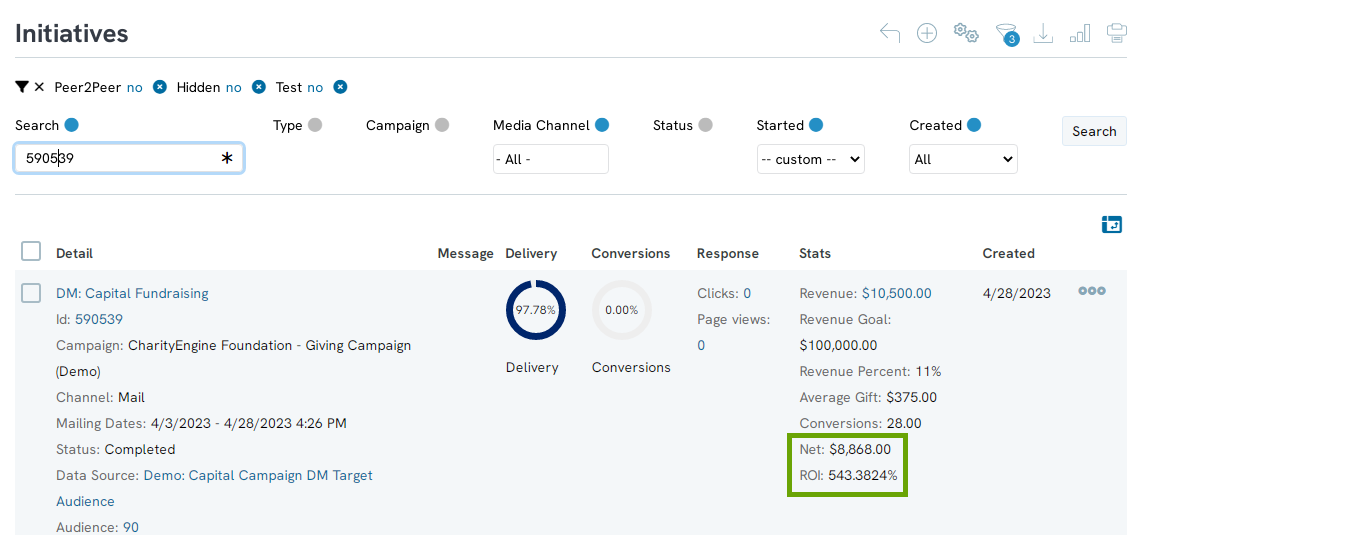
Step 5: As gifts are converted and assigned to the initiative, the initiative performance will populate on the initiative listing screen
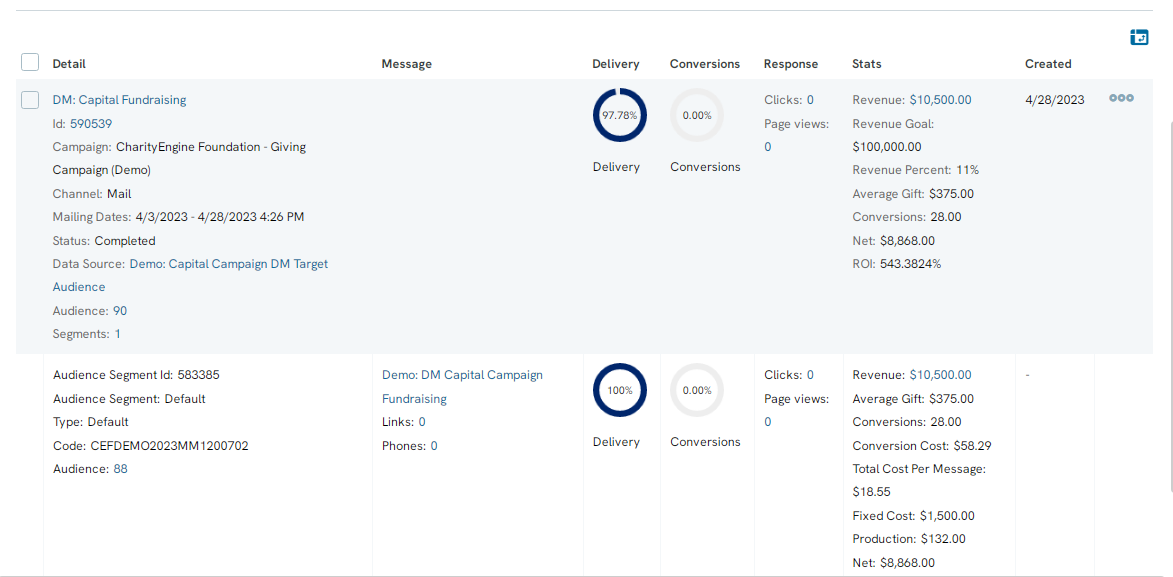
Click on Segment to expose segment details if more than 1 segment is used.
Note: If the user is incorporating segments:
Calculation Definitions:
- Initiative Fixed Cost: Overarching fixed cost for initiative. For example, our agency charges $500 regardless of the initiative, number of segments or audience size to send out a direct mailing
- Segment Fixed Cost: Fixed cost for a segment. For example, our mailing has two segments, the first is just a letter, the second is a large package and there is an up-front extra design fee of $1,000 for this to be drawn (not produced).
- Per Message Cost (Initiative or override): This is always calculated at the segment level and is the optional cost per message, excluding postage. For example, if, in addition to postage, you are incurring a fee of $2/envelope because one of your segments uses a special three dimensional envelope to increase conversions, you can track that using this value.
- Per Message Delivery Cost (initiative or override): This is your postage and handling fee, if applicable.
- Net: conversion revenue minus production, delivery and fixed initiative cost.
- ROI: net revenue divided by total costs as a percentage.
FAQ & Further Reading
| Data Element | Represents | How it is calculated |
| Audience | Represents total sized successfully delivered | Total source is calculated by reducing the initial audience size less the following cleansing activities: invalid data, duplicates, deceased contacts, inactive contact records, user opt-outs, blacklisted emails |
| Delivery % | Percentage of audience size, total delivery rate (used as denominator for subsequent rates) | Total audience less: failed and bounced emails |
| Views % | Percentage of unique users who viewed email | Total View Audience divided by Delivery % Success Value |
| Opt-Outs | Percentage of users who opted-out as a result of the email initiative | Opt-Out divided by Delivery % Success Value |
| Complaints | Percentage of users who reported the email as spam via their email service provider (ESP) | Complaints divided by Delivery % Success Value |
| Click Through | Percentage of unique users who clicked within the email | Unique clicks divided by Delivery % Success Value |
| Page Views | Percentage of unique users who navigated to a web page | |
| Conversion | Percentage of delivery audience who took financial action | Unique users divided by Delivery % Success Value |
Q: Can I see the analytics of other types of initiatives?
A: You will be ale to see the analytics of all types of initiatives, however you will only be able to see the view, open, and success rates of emails and SMS messages.
A. Yes. By accessing the Reports & Analytics App > Campaigns > Send Failures to see each summary of all failures. Alternatively, you can navigate to Reports & Analytics App > Campaign > Initiative Analytics to view all email initiatives send summaries.
A. Managing your email list is crucial for not only reaching your constituents but for also managing your reputation as a sender. CharityEngine has integrated several technology tools to assist you in list management. Our outbound email delivery technology actively tracks and reports on responses in which the email address is reported as invalid. Once confirmed as invalid, CharityEngine will identify the user’s email address to prevent future email delivery failures. Read more here regarding email blacklisting.
Here are the fields for that analytic report:
- Contact Count: total contacts in database
- OptIn Count: total contacts opted into lists at time report is run
- OptOut Count: count of unsubscribe logs from the campaign app (different from preference changes)
- Client Blacklist Count: count of black listed emails in client instance
- Client System BlackList Count: count of system-wide blacklisted emails in client instance
- Net BlackList Count: count of total blacklisted emails (client and system wide)
- Fails: email send failure count
- Hard Bounces: email hard bounce count
- FeedBack Loop Events: email complaints count
- Average Engagement Score: average contact engagement score