Introduction
CharityEngine has a host of reporting options to assist you and your users to quickly and easily gain insights to your donors, their actions, and engagement with your organization. While there are over 90 out of the box reports, CharityEngine also provides you with more customizable reporting throughout each of the applications. The CharityEngine Reports & Analytics Application offers a comprehensive offering of over 90 out of the box reports and dashboards to allow you to quickly access critical information related to your donors and your database. Take a moment to review the various reports within each section for quick and easy access to reports.
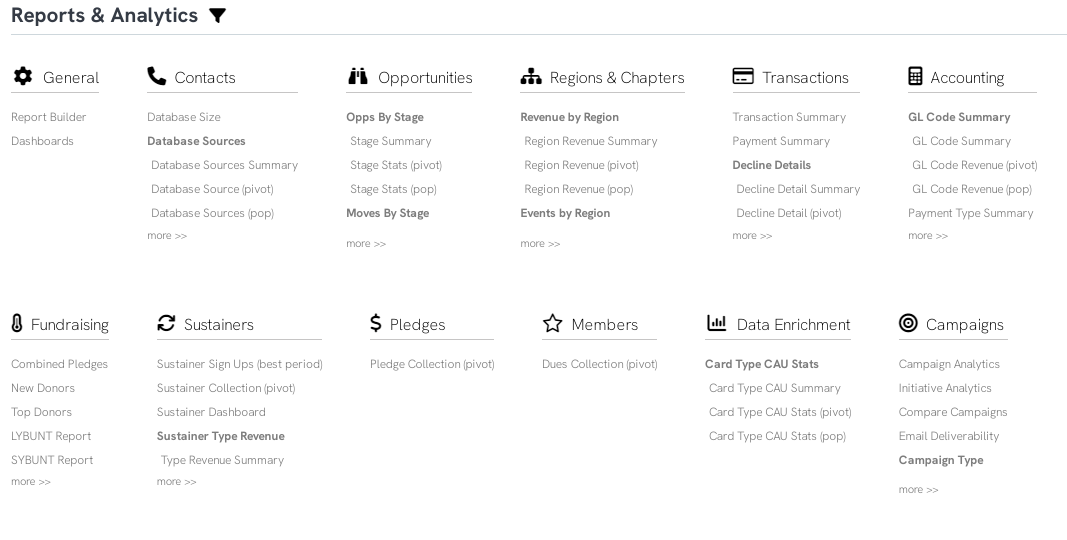
Table of Contents
Prerequisites
- Reporting is available for all users
- Some features reporting only available if included in the account. Please see your account manager if you would like to learn more about a specific feature.
Reporting Categories & Summary
Below is a summary of the various reporting categories. Feel free to explore all reports to locate those which may be beneficial to you and your organization.
| Category | Description | Top Reports |
| General | Configuration elements to allow users to manage private and public reports, reports scheduling as well as dashboard creation and management. |
|
| Contacts | Reporting centered around contacts within your database. |
|
| Opportunities | Executive summary and details for moves management reporting. |
|
| Regions & Chapters | Reporting summaries designed to summarize contact region assignment. |
|
| Transactions | Executive summary and details regarding donation performance. |
|
| Accounting | Accounting reports to evaluate financial details. |
|
| Fundraising | Reports designed to summarize fundraising details. |
|
| Sustainers | Monitoring and tracking of recurring gift performance. |
|
| Members | Monitoring and tracking of membership performance. |
|
| Data Enrichment | Reporting for integrated CharityEngine data enrichment features. |
|
| Campaigns | Monitoring of email bulk sending performance designed to assist organizations maximize their email sending performance. |
|
| Events | Monitoring of event activities and details. |
|
| Advocacy | Monitoring of advocacy activities. |
|
| Funds | Accounting/finance reporting for funds assigned to transactions. |
|
| Grassroots Event (peer to peer) | Peer to peer reporting to summarize performance and engagement of events. |
|
| Online | Reporting for monitoring of website visitors and web form performance. |
|
| Email Blast | Monitoring for email design/engagement and domain performance. |
|
| Database | Monitoring of database users. |
|
| Security | Evaluate and monitor fraud transaction trends and those who are accessing your web forms. |
|
| Polls & Surveys | Easily access the results of your polls or survey results. |
|
| Merchandise | For use with Shopping Cart - allows user to monitor inventory and orders. |
|
| Cases | Monitor cases submitted by users and/or donors. |
|
Reporting Feature and Structure
Here are a few tips & tricks when utilizing our out of the box reporting:
- Advanced Filter - available on most reports in the top right hand corner to refine your search/report needs
- hyper links - many of the reports will allow the user to click through for details
- Summary, pivot, vs. pop - there are select reports that allow the user to have data presented in a summary view (typically table view), or within a pivot table view, or comparison view for period over period (pop)
- Dashboard - look on executive dashboards to modify date ranges
- Export Results - in the top right hand corner, use the 4 box icon to export results to excel
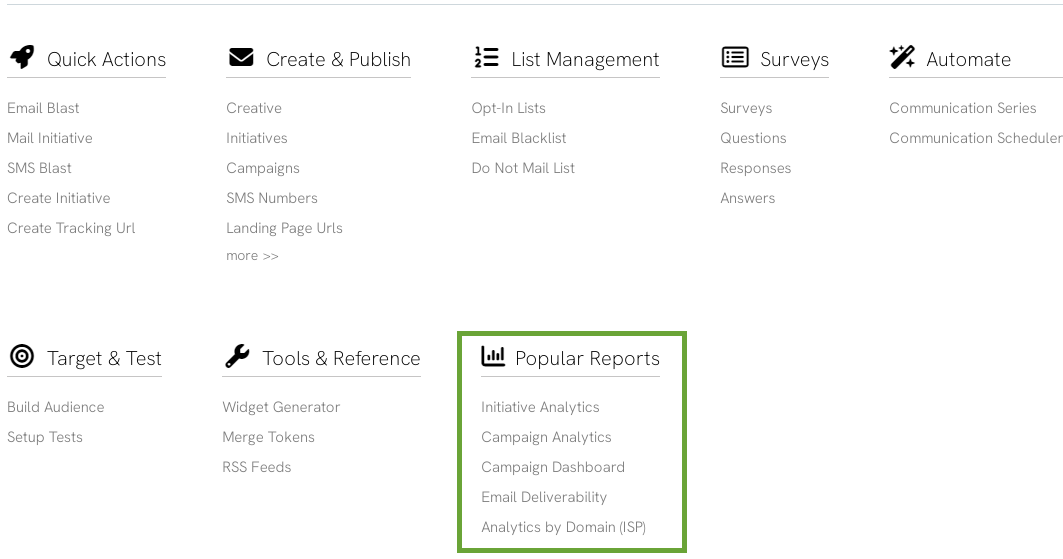
Please also note that each application will also have a section identified as Popular Reports which will also allow users to quickly access top reports associated with the application. These reports will be listed in the Reports & Analytics landing page.
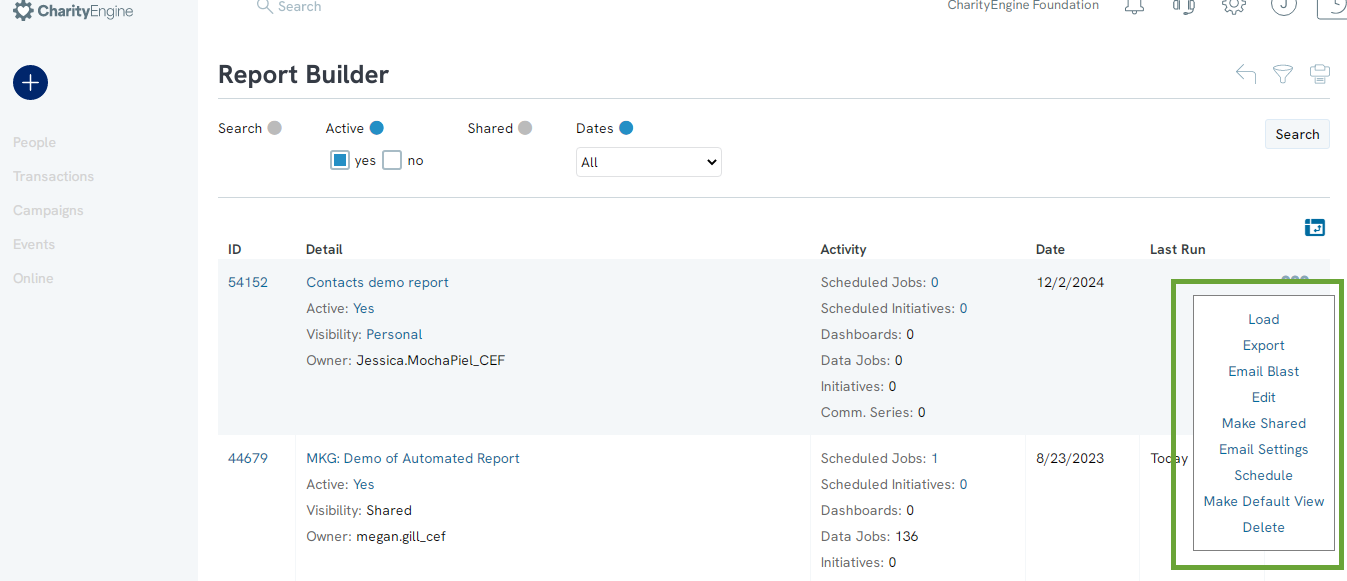
Report Builder
By accessing the Reports & Analytics App > General > Report Builder, you can access a listing screen for all available reports. These reports are those created and saved from the Reports Listing Screen feature. Reports you have created will be presented to you with a visibility setting of "Personal". If there are reports with visibility of "Shared" indicate those that are available for public view.
Leverage the ACTIONS menu to export, email the report, edit the report, share the report, adjust any emails (add/edit/delete) for reporting delivery on recurring schedules, adjust any defined scheduling of the report (add/edit/delete for desired frequency), create as a default view, or delete.
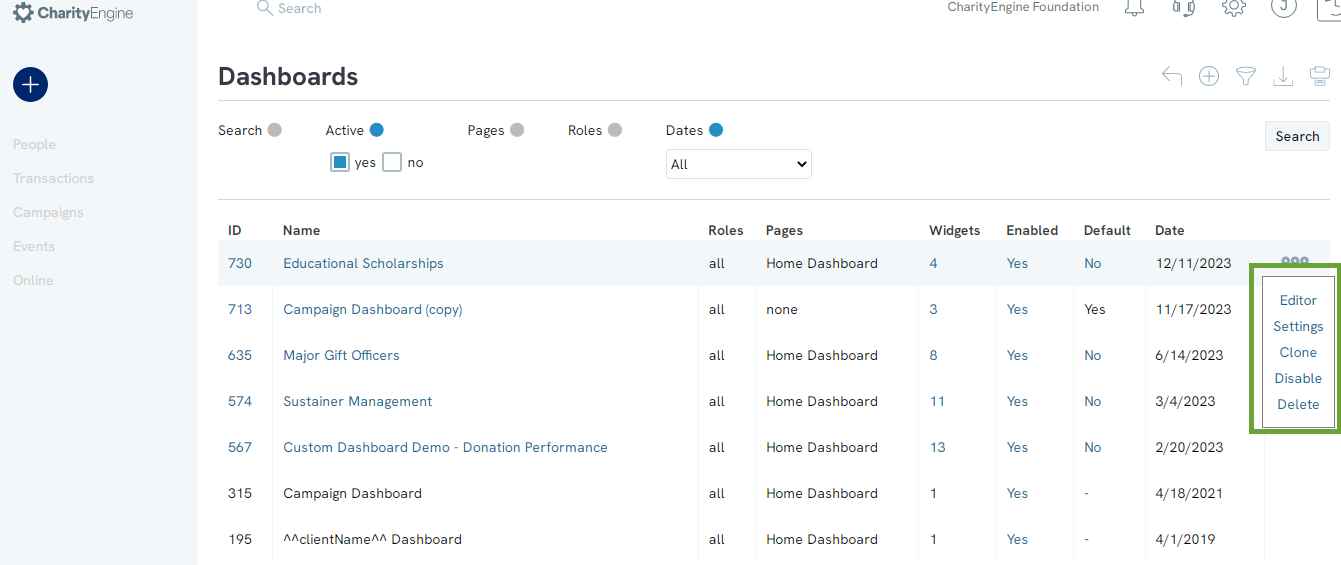
Dashboards
By accessing the Reports & Analytics App > General > Dashboard, you can access a listing screen for all created dashboards. As a default, you will have an out of the box dashboard for Dashboard as well as a Campaigns Dashboard. Any additional dashboards that have been customized will be presented here. In addition to accessing the Create New to initiate a new dashboard, access the ACTIONS: column to expose options to navigate to the Editor, adjust the dashboard Settings, Clone the dashboard, Disable the dashboard, or Delete the dashboard.