Introduction
CharityEngine has a host of reporting options to assist you and your users to quickly and easily gain insights to your donors, their actions, and engagement with your organization. While there are over 90 out of the box reports, CharityEngine also provides you with more customizable reporting throughout each of the applications through our Report Builder feature. This article is intended to provide you with an overview of the various reporting features located within CharityEngine.
Table of Contents
Prerequisites
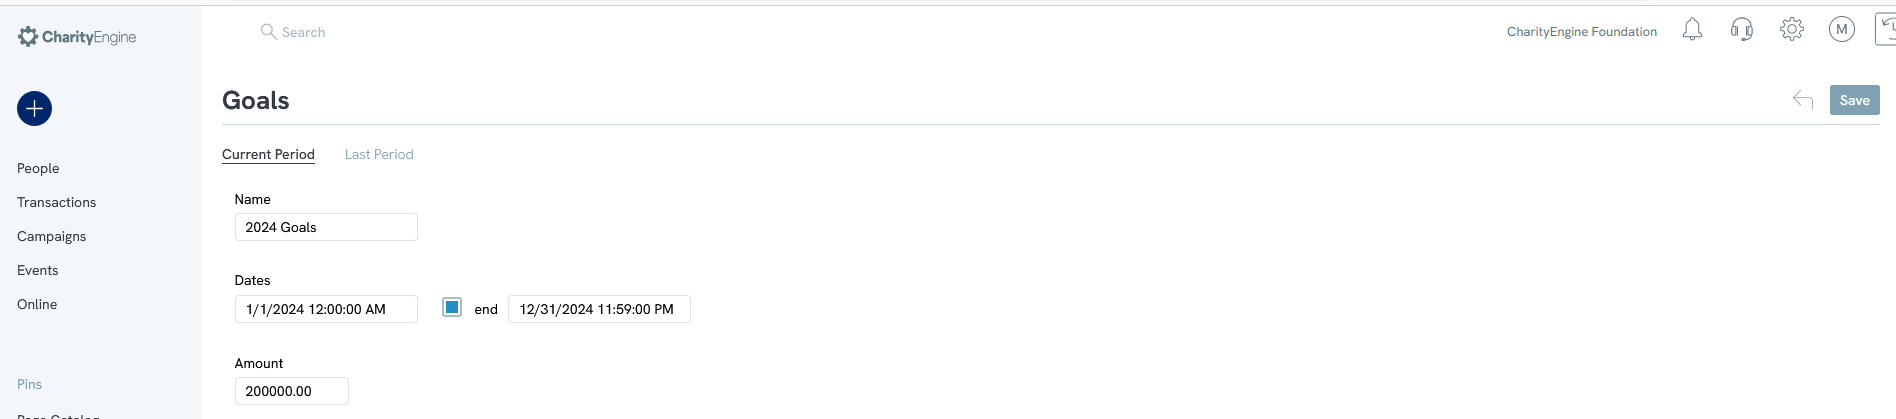
To use gift totals from the main, out of box, dashboard, the user will need to set Current Period Goals within the Configuration App.
This value can be set by accessing the Configuration App > General > Goals > Current Period
Overview - Reports & Analytics
The CharityEngine Reports & Analytics Application offers a comprehensive offering of over 90 out of the box reports and dashboards to allow you to quickly access critical information related to your donors and your database.
To get started, navigate to the Reports & Analytics App > Dashboard
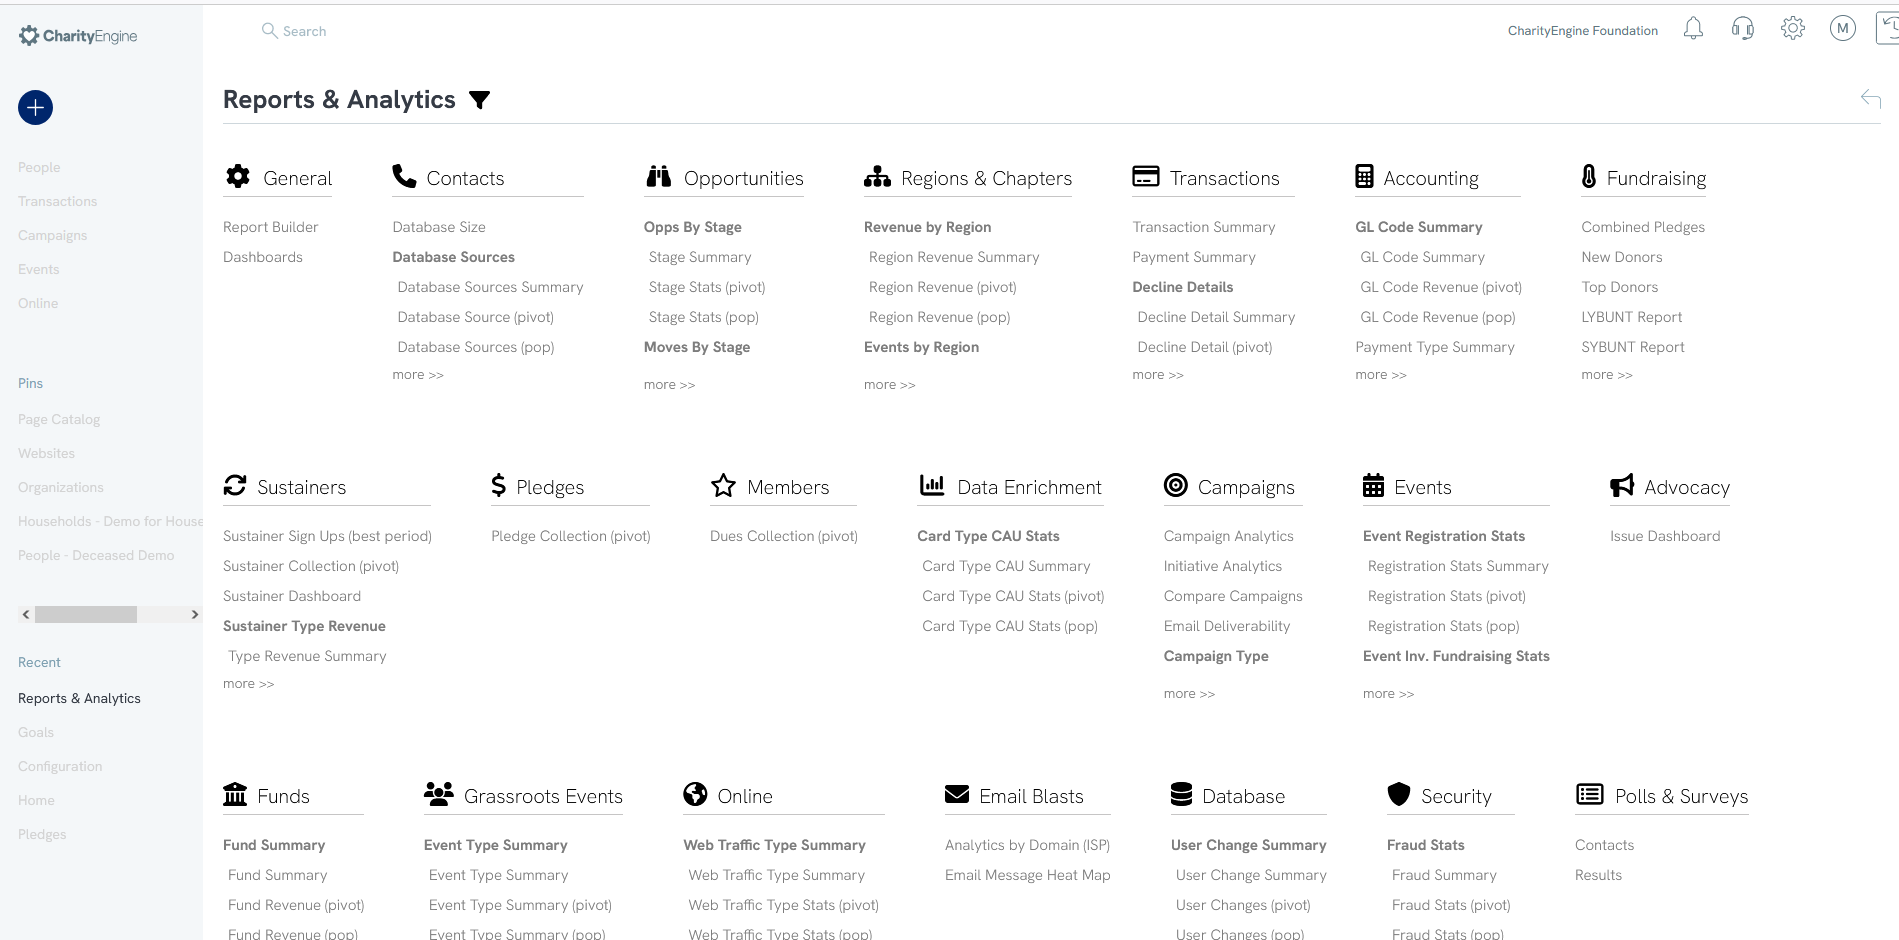
Each of the reports are grouped within like categories ranging from Fundraising, Sustainers, Polls & Surveys, Campaigns, and so much more. Each report will provide you with general filters and Advanced Filters. Many reports also allow the user to export or print for additional research or distribution. Some of these top reports will also be presented within each application within the Popular Reports section.
Here are some of the most frequently used reports:
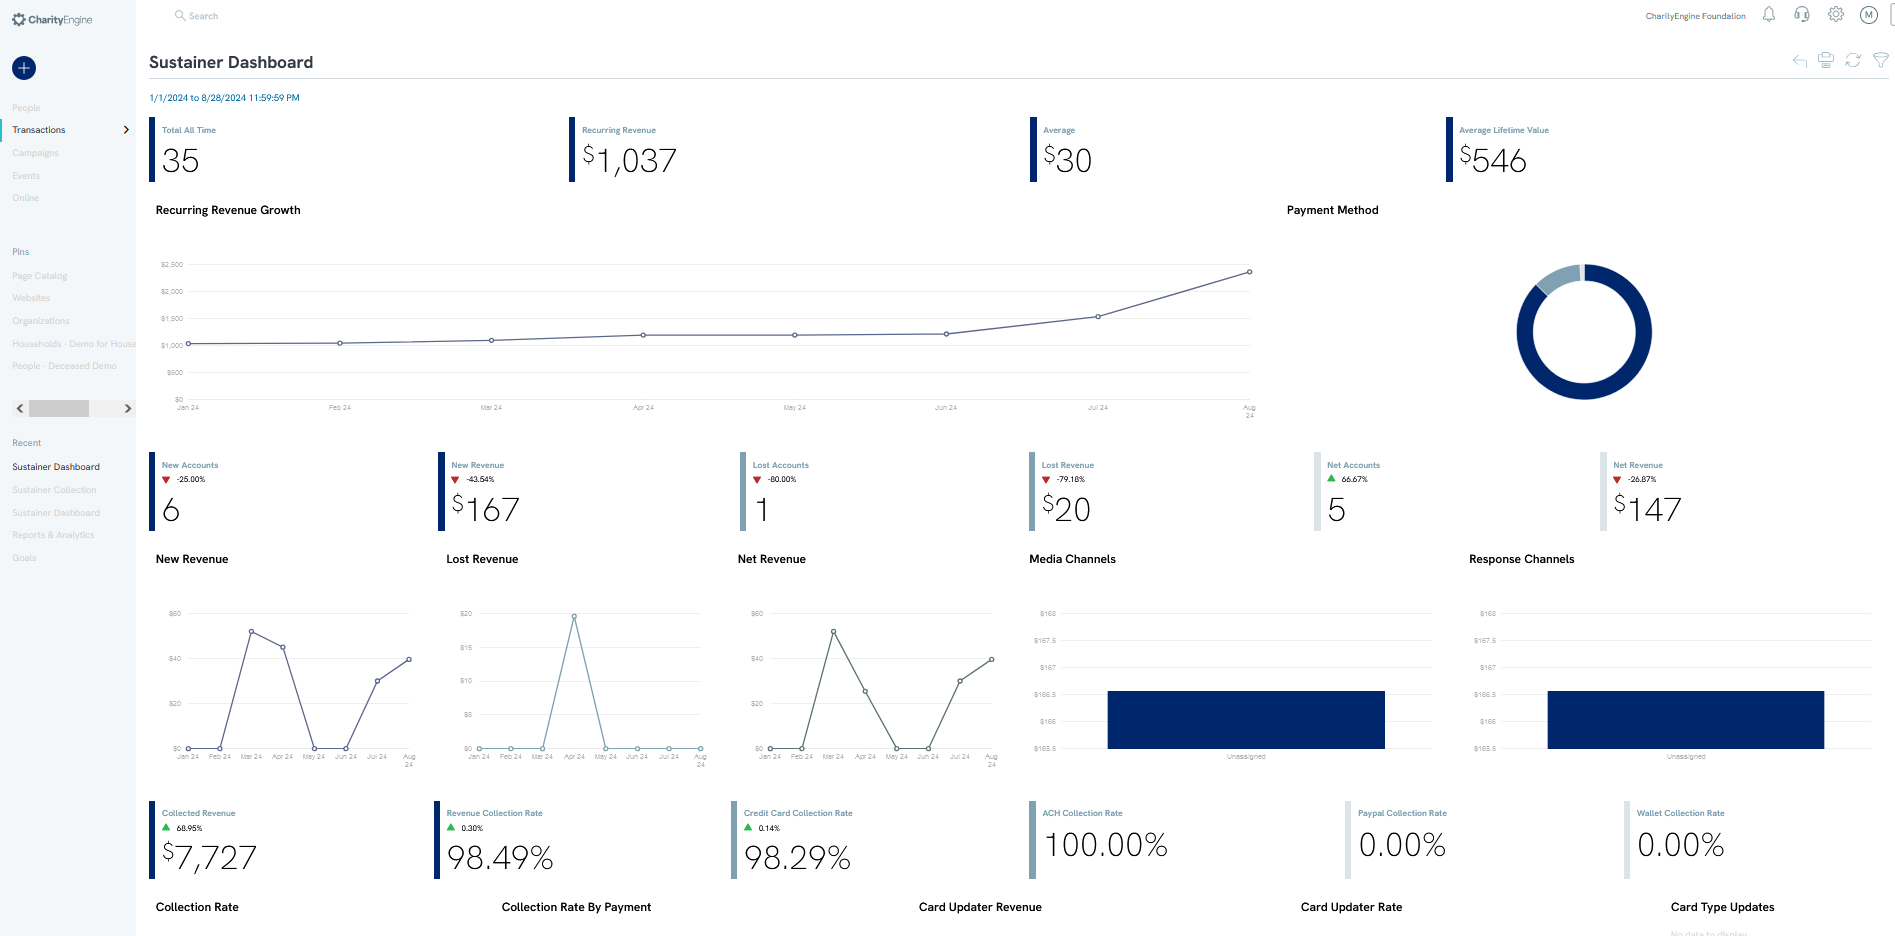
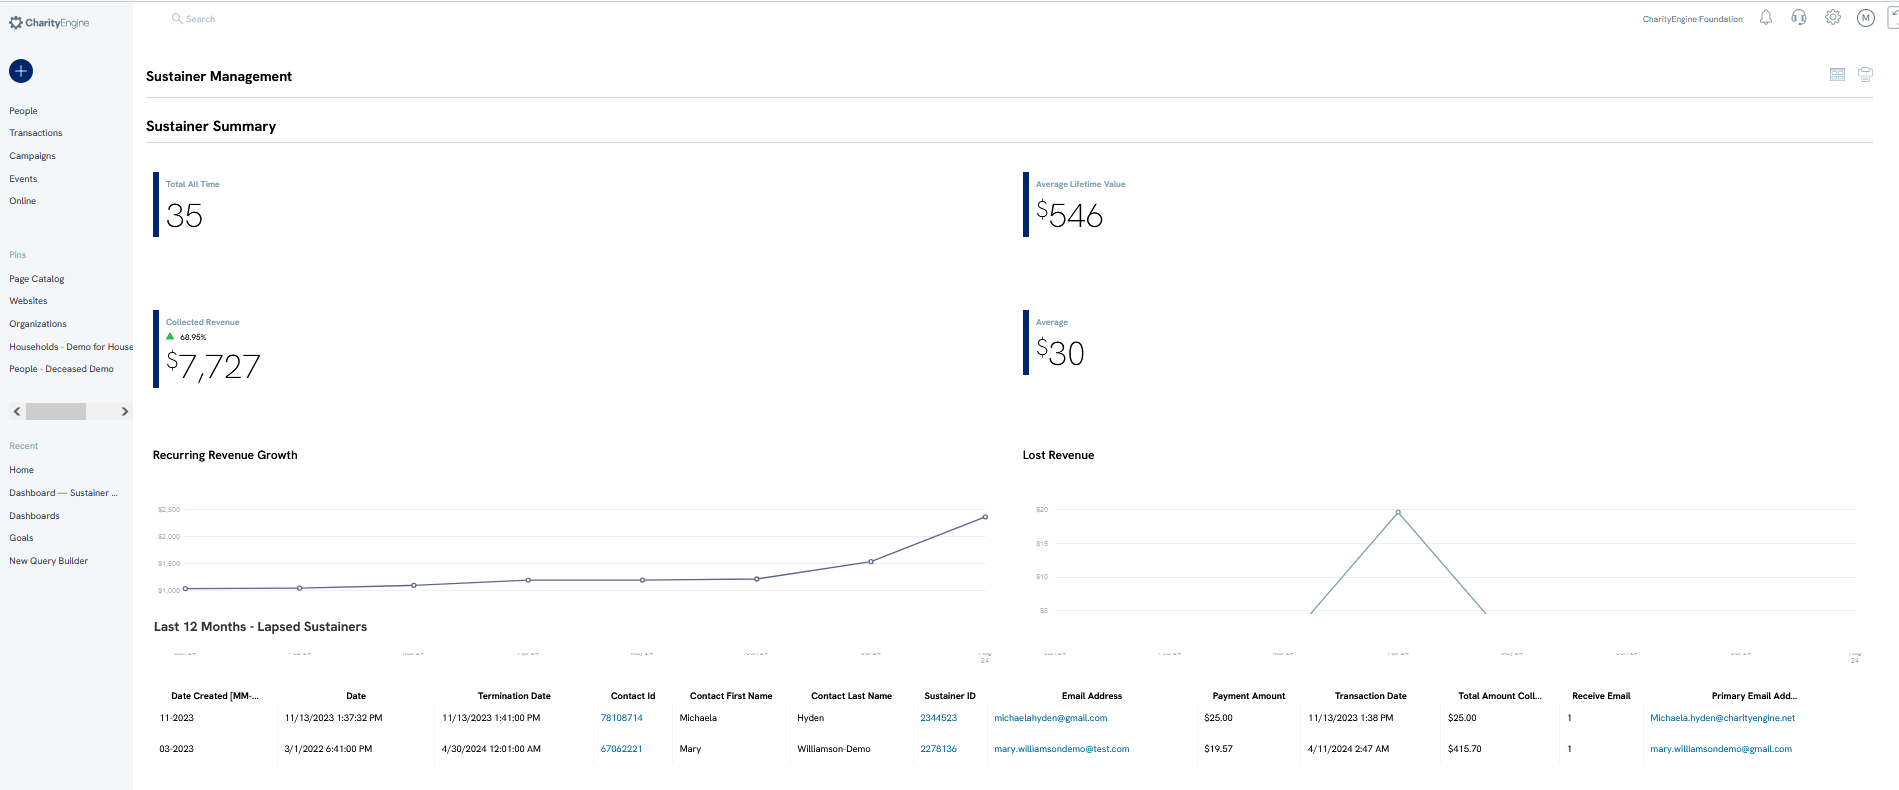
Sustainers: Sustainer Dashboard - Providing you with an executive summary of sustaining donors engagement. This dashboard allows you to drill down on most widgets and access new metrics, including active and passive churn and lost revenue by media channel. This out-of-the-box dashboard provides critical metrics needed to assess the health of your sustainer program and pinpoint areas for improvement.
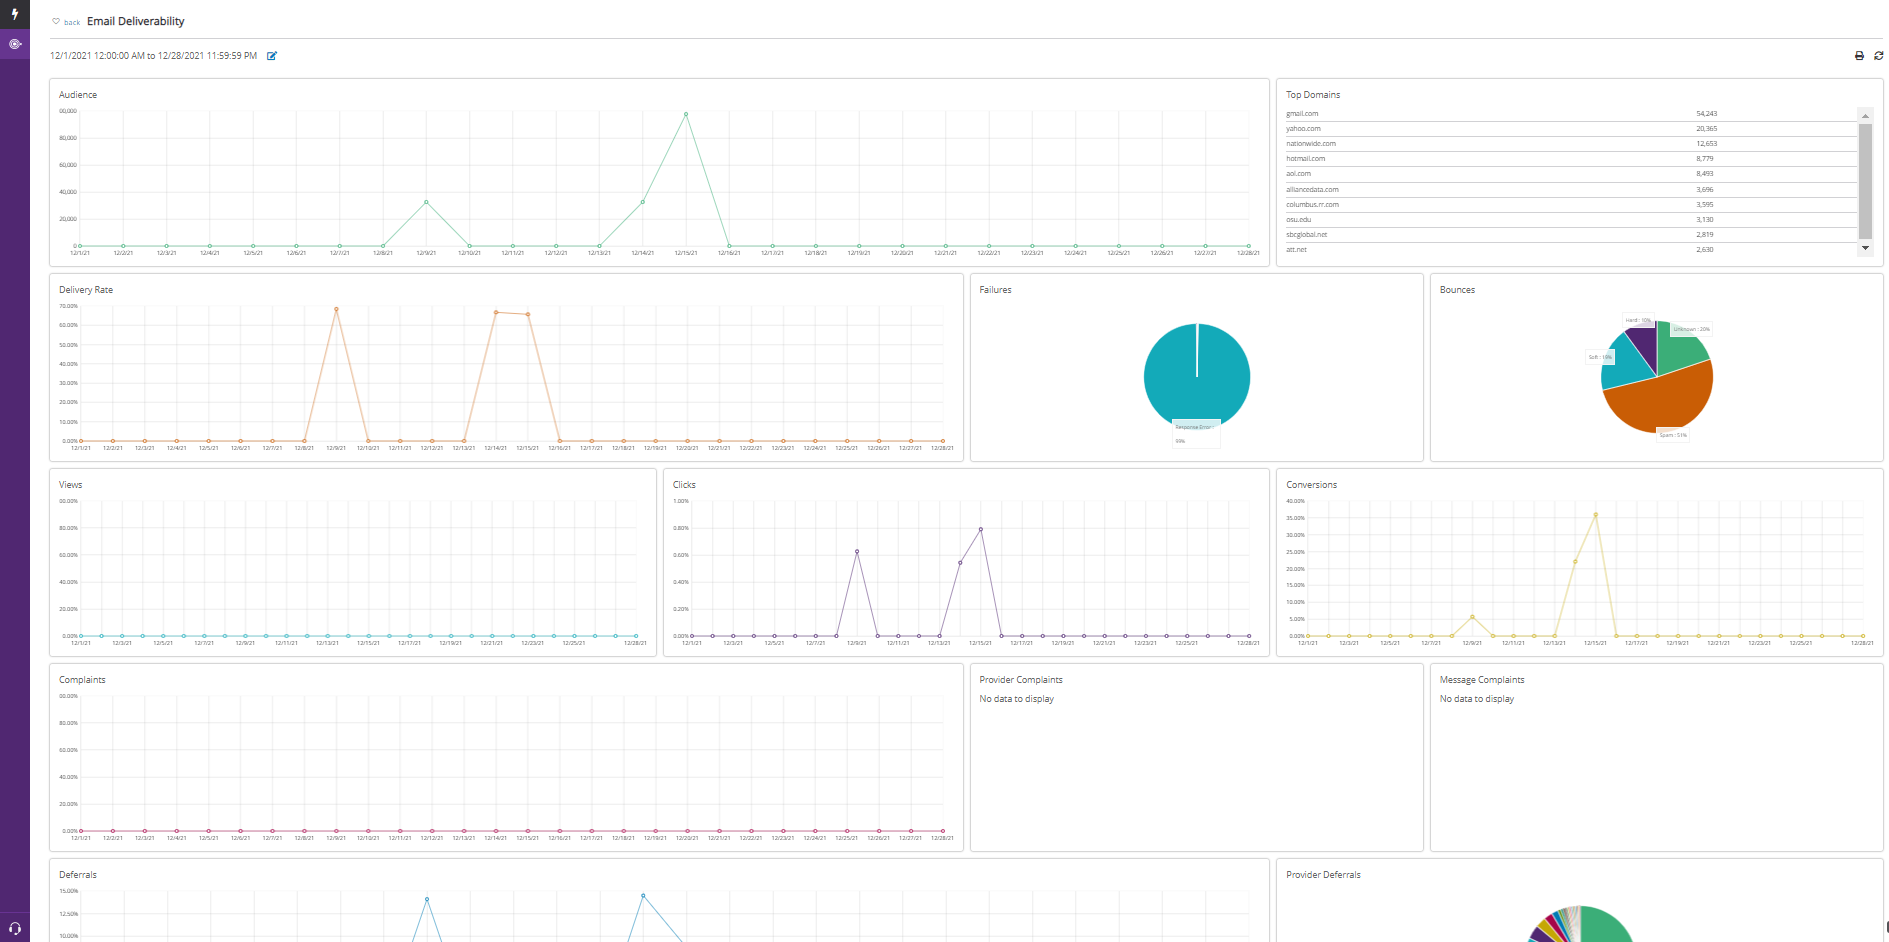
Campaigns: Email Deliverability - This dashboard will provide you with an overview of your email deliverability performance to identify trends and monitoring for bulk email sending practices within your organization
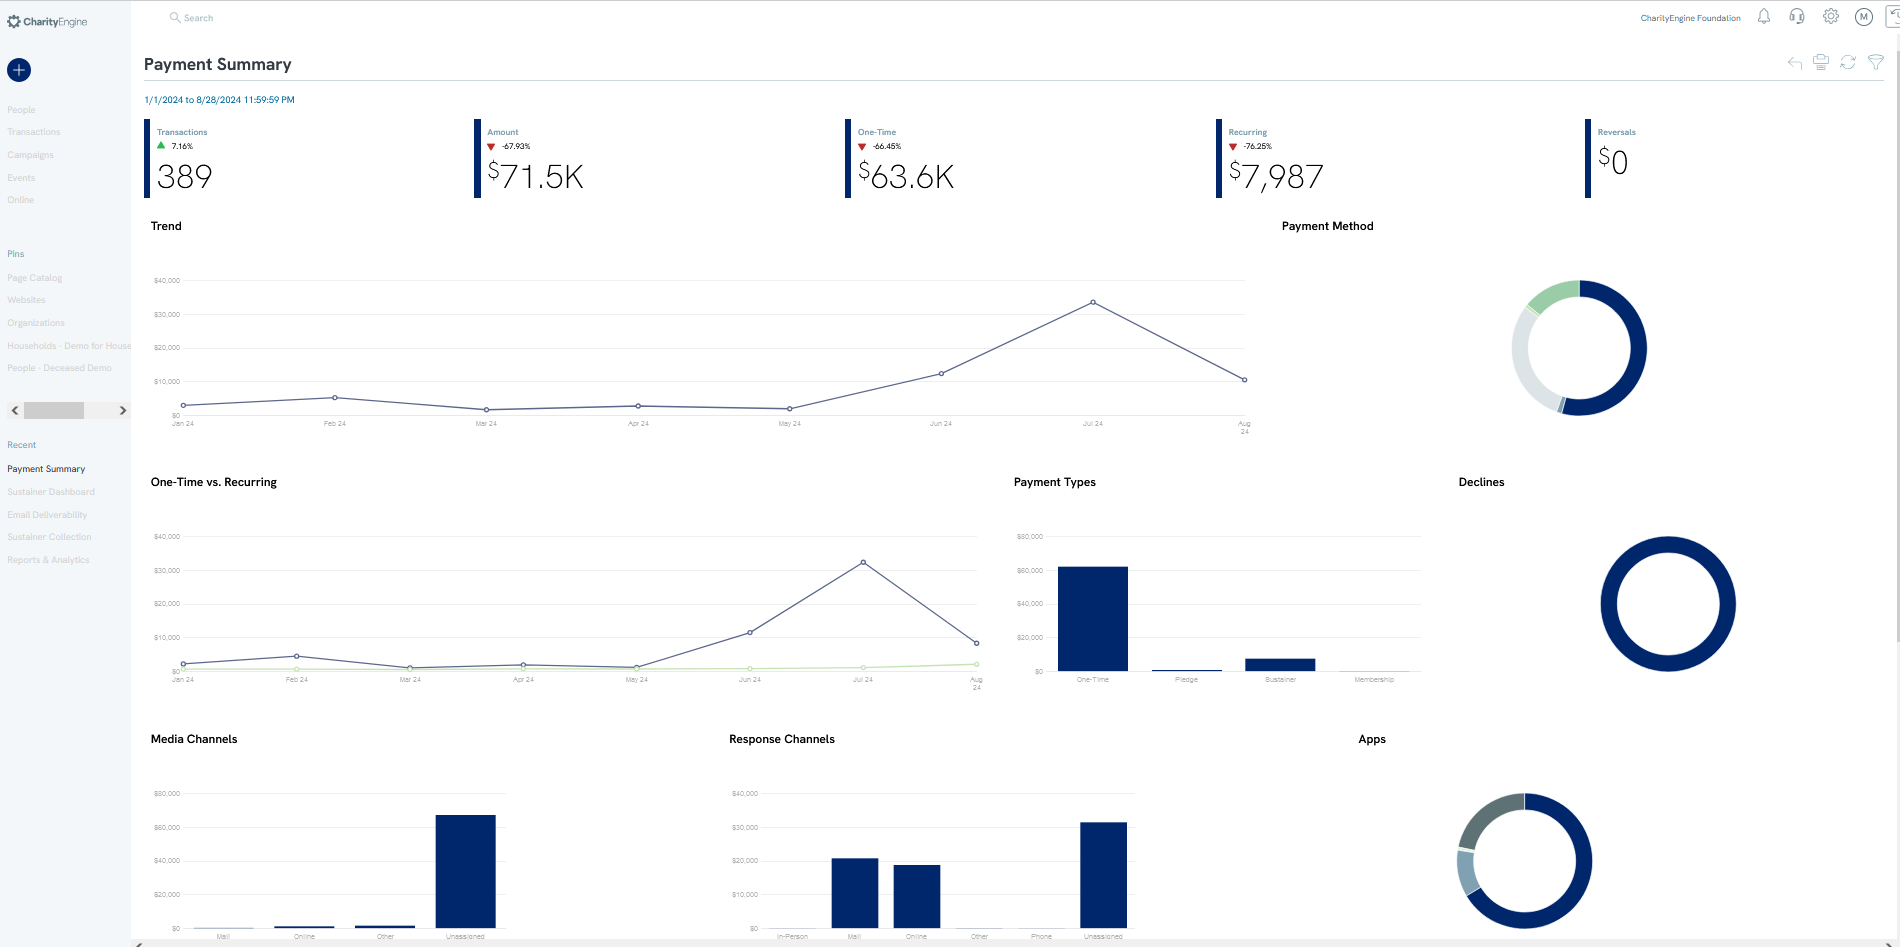
Transactions: Payment Summary - Utilization of this dashboard will provide you with an executive summary dashboard providing you with trend analysis on donation performance across one time, recurring, memberships, pledge payments
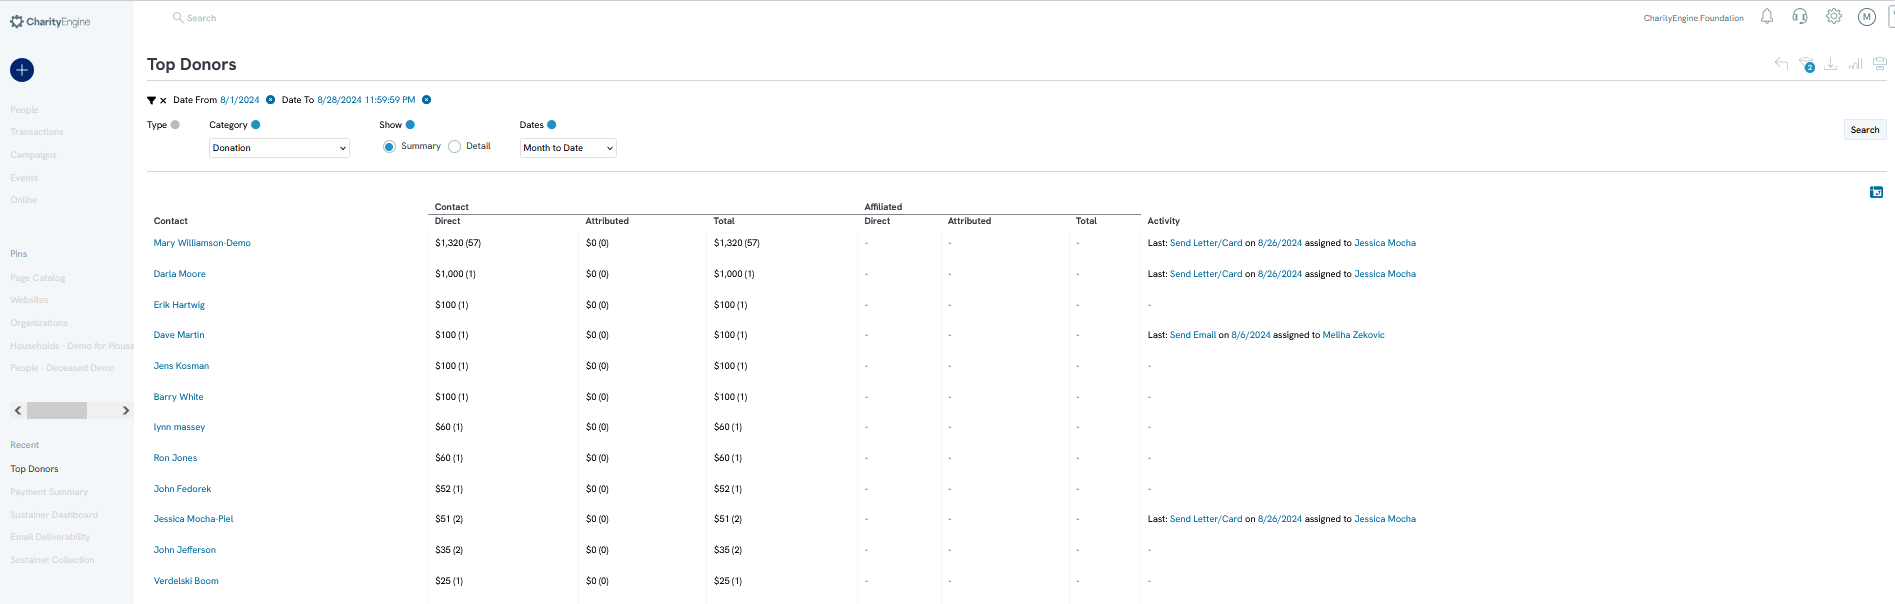
Fundraising: Top Donors - Leverage this report to quickly assess and locate your organization's top donors including their direct contributions and those attributed through a household or organization
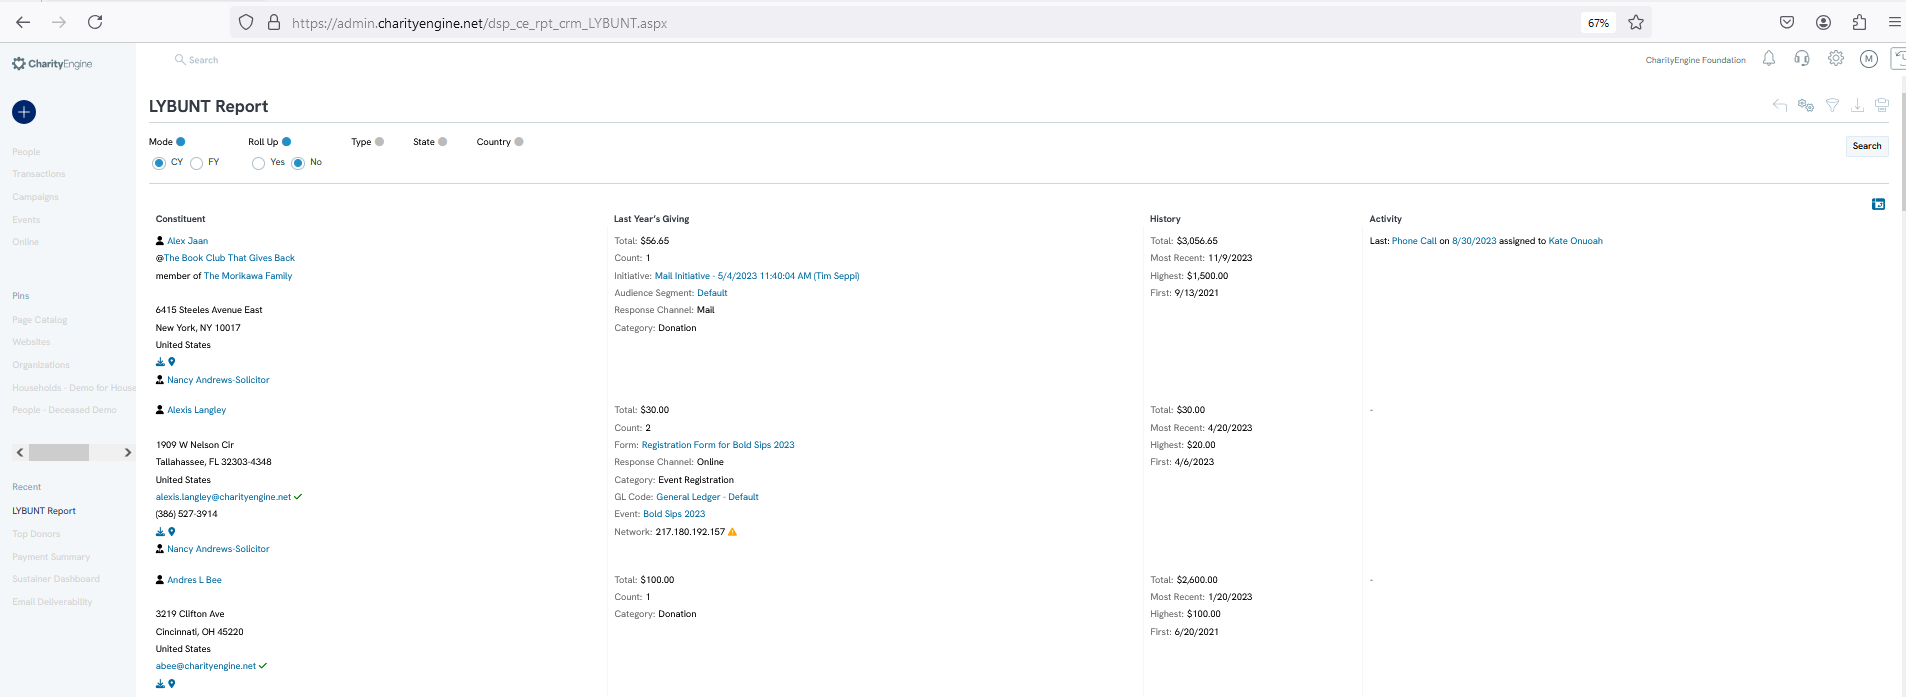
Fundraising: LYBUNT (Last Year But Not This Year) - The LYBUNT Report can assist you in quickly identifying opportunities with donors who contributed last year but has not contributed this year. This report allows for advanced filtering, such as GL Code and Fund for more segmented reporting
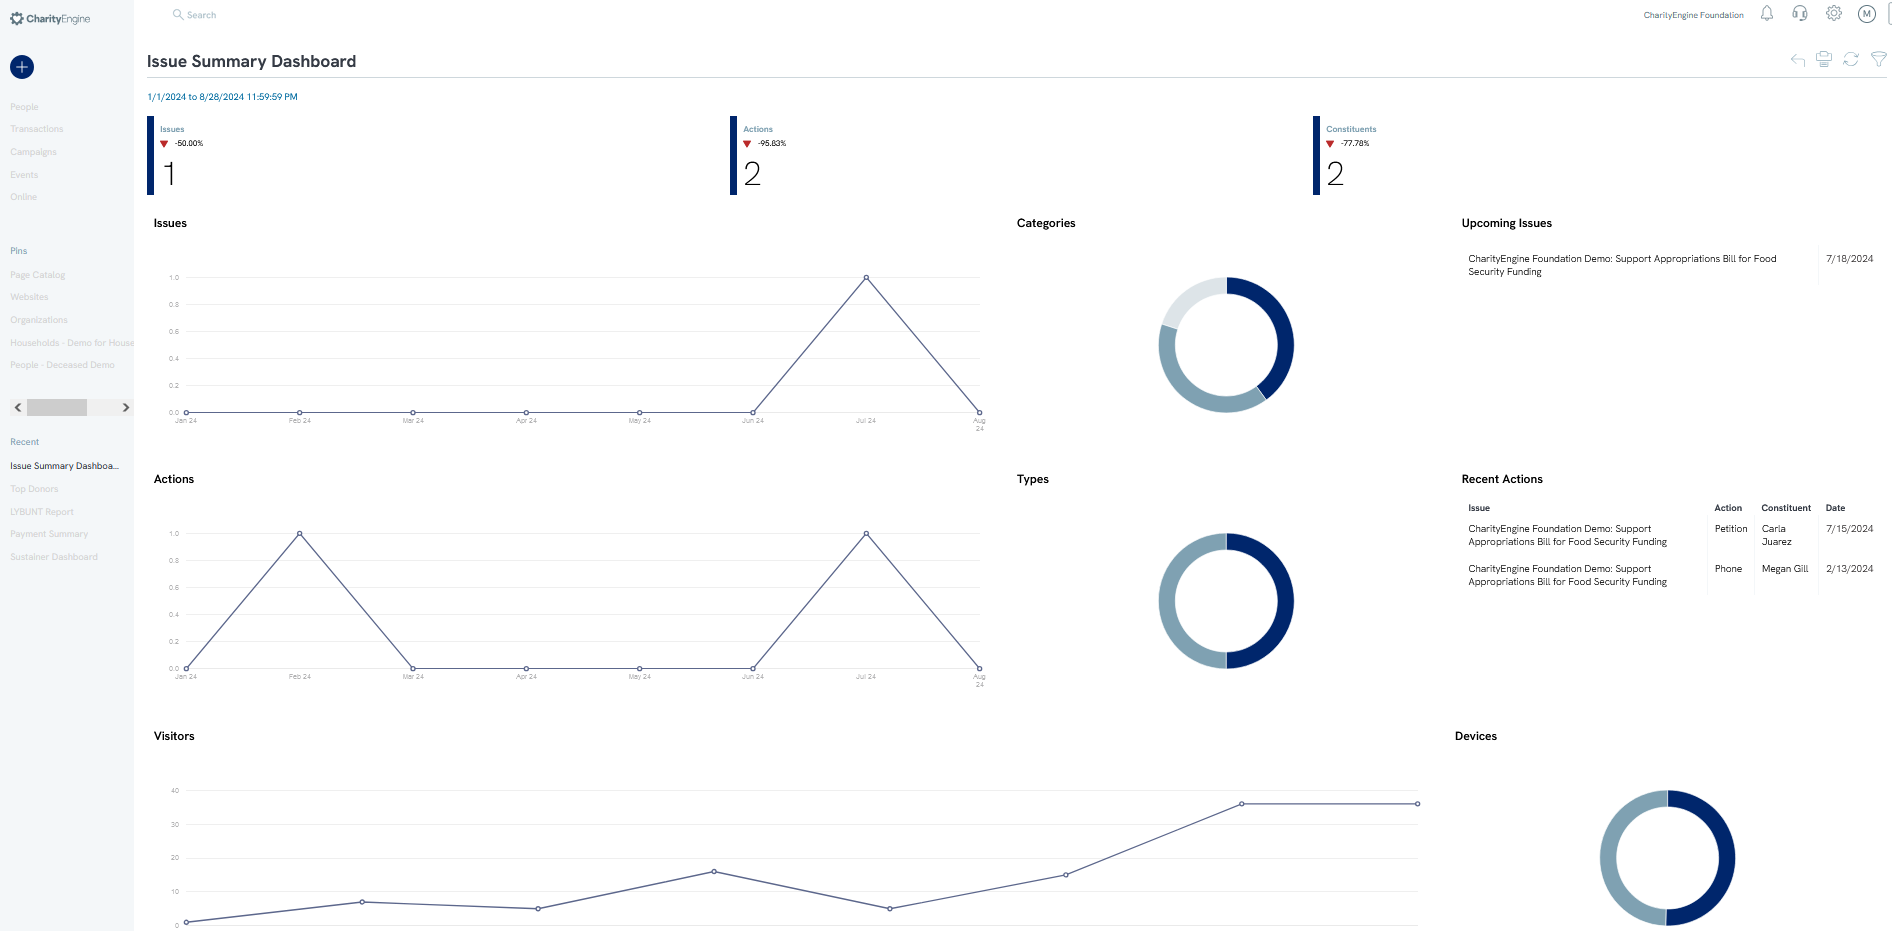
Advocacy: Issue Dashboard - CharityEngine’s new Advocacy Dashboard shows you information on the issues you’ve identified as important, as well as showing you details about your constituents and the activities in which they’re taking action.
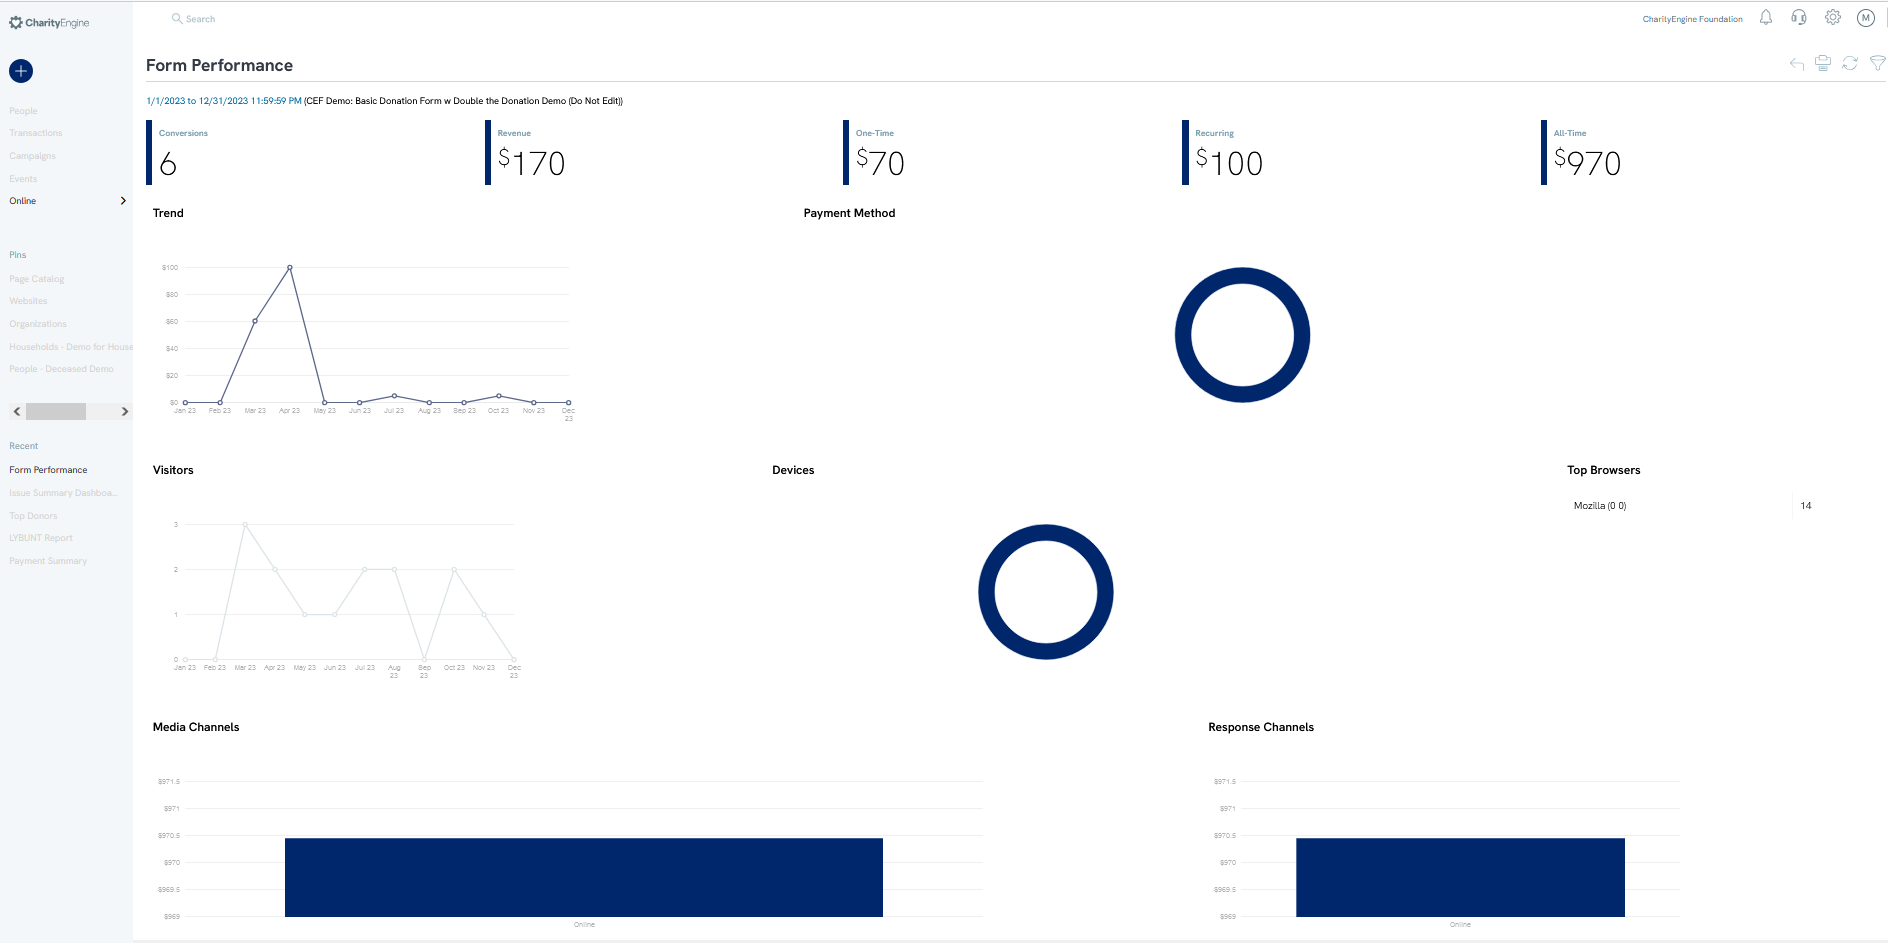
Online: Form Performance - This dashboard zeroes in on how your forms are doing. For example, how many people are clicking on your donation form but neglecting to donate? If the number is lower than you like, it’s an indication you need to optimize your donation form to increase fundraising.
Note: For reports that have a hierarchal structure users can now toggle between flat and rolled-up views. This feature applies to key data dimensions such as Funds, GL Codes, Campaigns, and Channels
Overview - Quick Filters & Advanced Filters
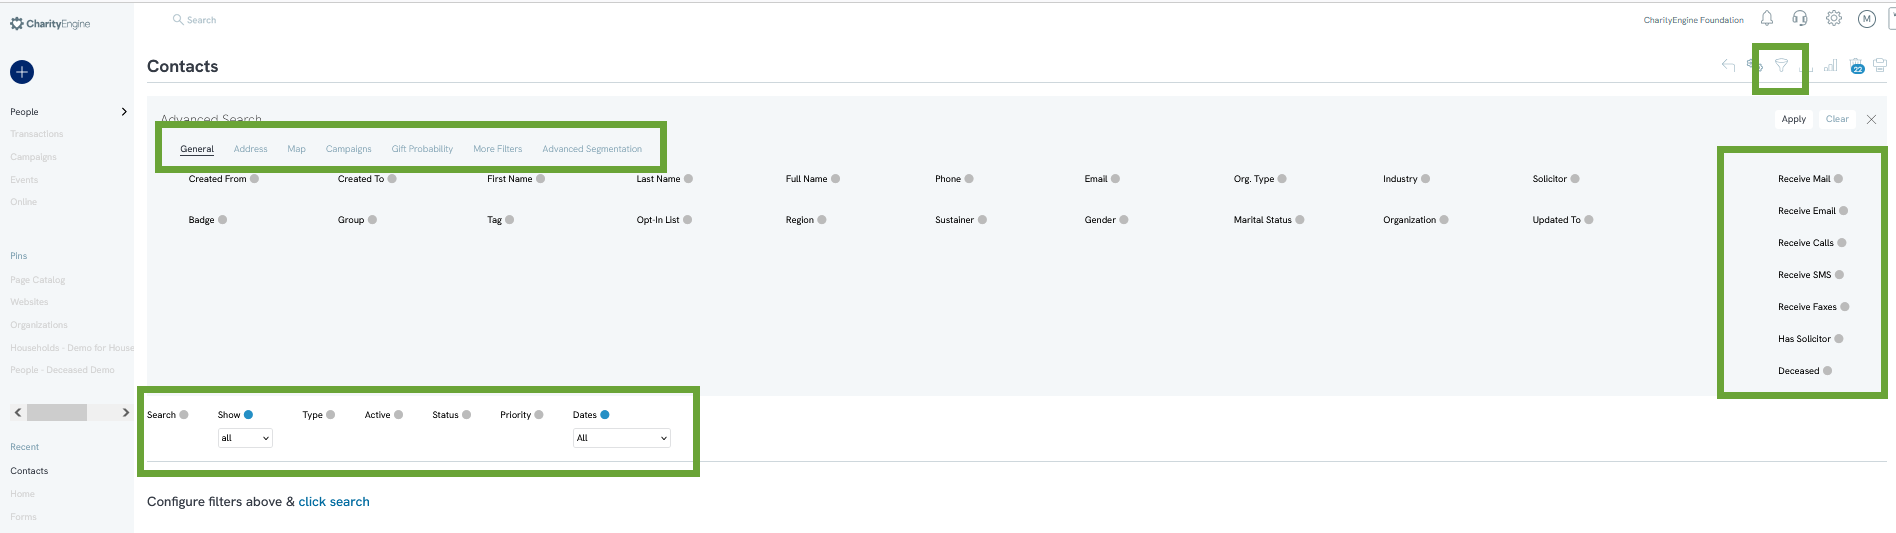
Within each application and feature, Quick Filters will be displayed to allow users to easily and quickly filter and locate necessary information. Each module will also present an Advanced Filters with various tabs allowing refined filtering by data elements. Navigate and explore the various filtering options while also noting fields that contain yes/no toggles. Create a mixture of data filters to narrow the needed reporting results. Click APPLY to capture all data filters.
Example: People App > Organization & People > Contacts
Overview - Report Builder: Reports from Listing Screen
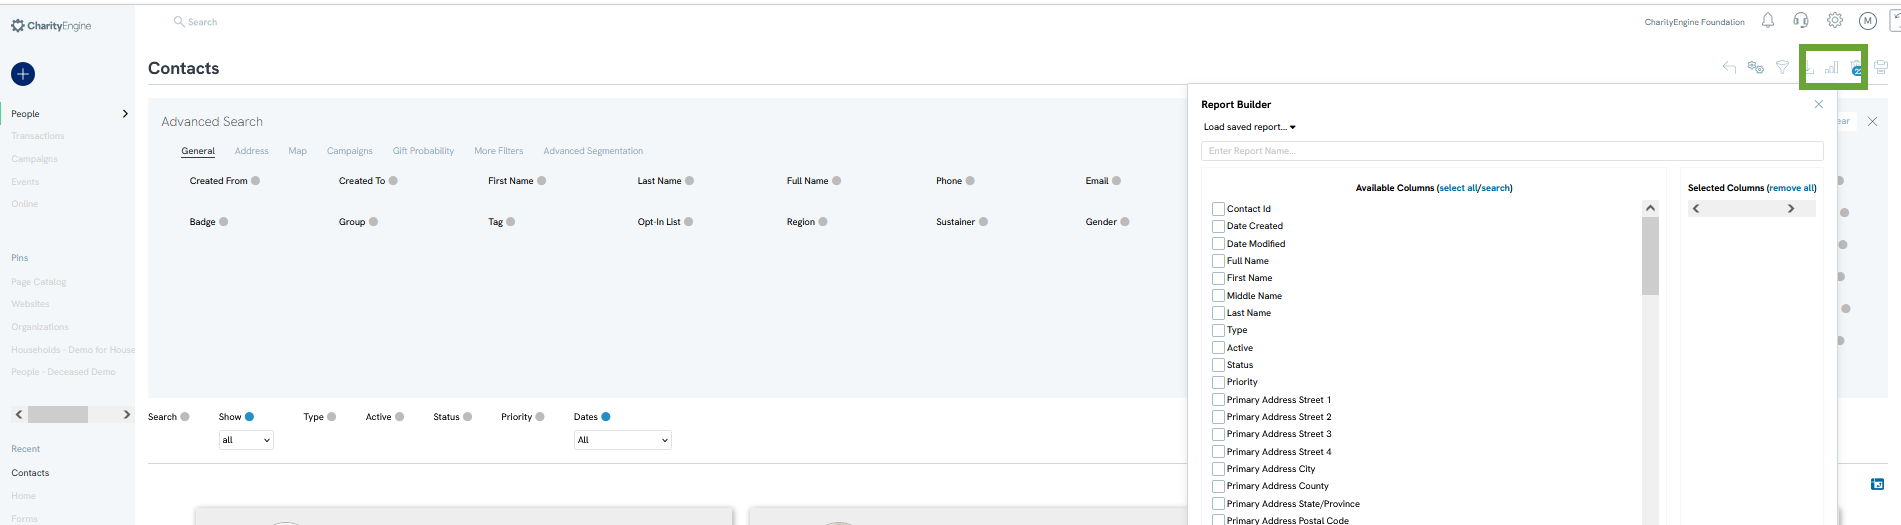
Now that you have seen the comprehensive out of the box reporting options, we will next introduce you to additional custom reports that are available throughout CharityEngine. At the top of most listing screens, you will find a graph icon in the top right-hand corner that allows a user to create a customized report, known as the Report Builder.
Once you have finalized your search criteria, easily click on the Report Builder (graph icon), name your report, and select the fields you wish to include in your reporting outputs. Click on SAVE or SAVE & EXPORT to retrieve your results.
Leveraging this custom reporting allows users to easily capture the information they may need. In addition, this feature allows users to create automated reporting schedules which can also be exported and emailed to you and others within your organization - further helping to ease time and effort needed for frequent reporting. Once the report has been saved, you will able to easily access in the future leveraging the Load Saved Report.
CharityEngine recommends leveraging the Reporting functionality as a best practice due to its ease of use for end users and the ability to quickly schedule recurring report delivery. Explore the Advanced Search feature to create refined reporting segments across a host of data points.
Overview - Queries
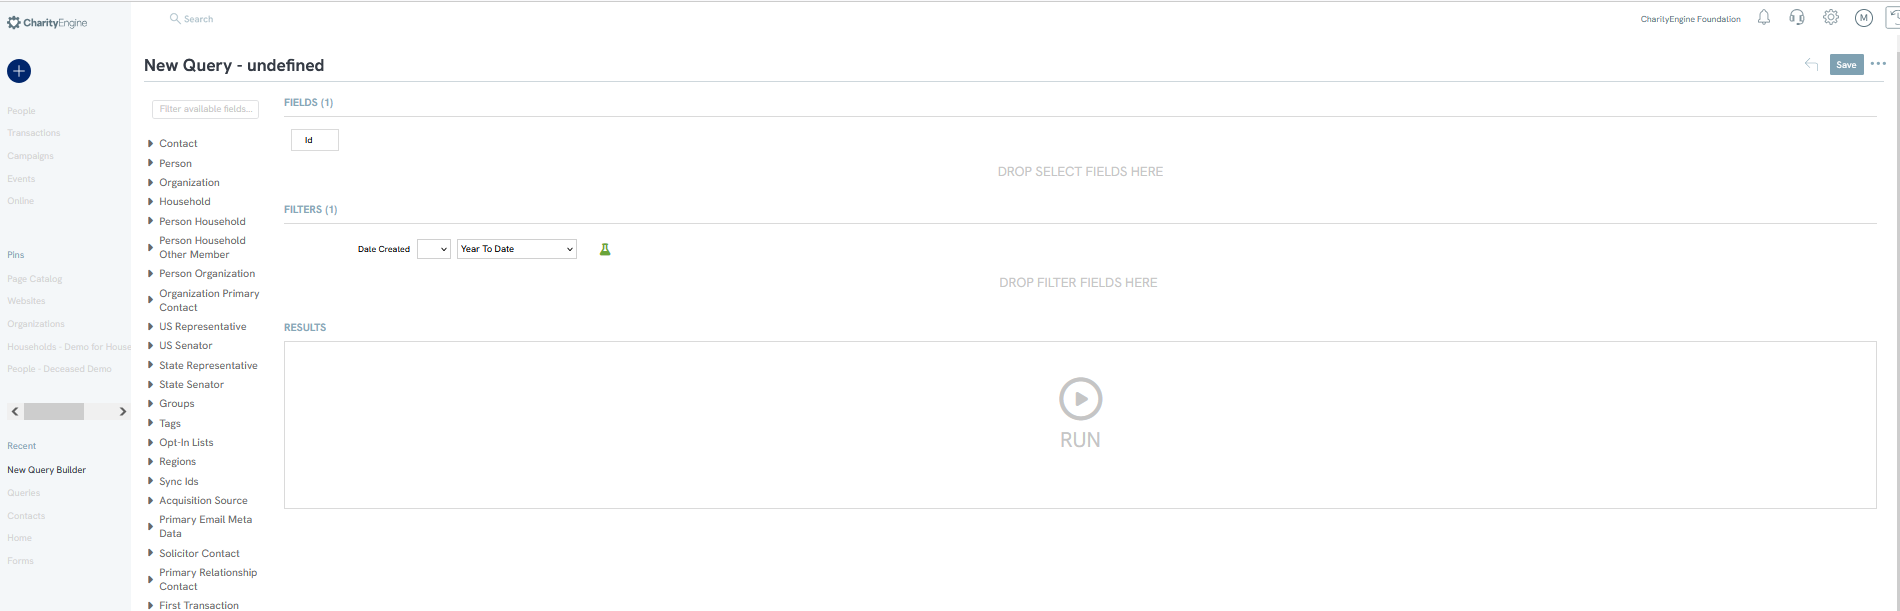
For advanced users, our Automation & Workflow App offers users the ability to leverage our query tool for advanced reporting needs that cannot be achieved through the Reports Listing Screen or from our out of the box reporting feature. Due to the complexity of this feature, we encourage users to start with the Reports Listing Screen as outlined above.
To access our query tool, navigate to the Automation & Workflow App > General > Queries
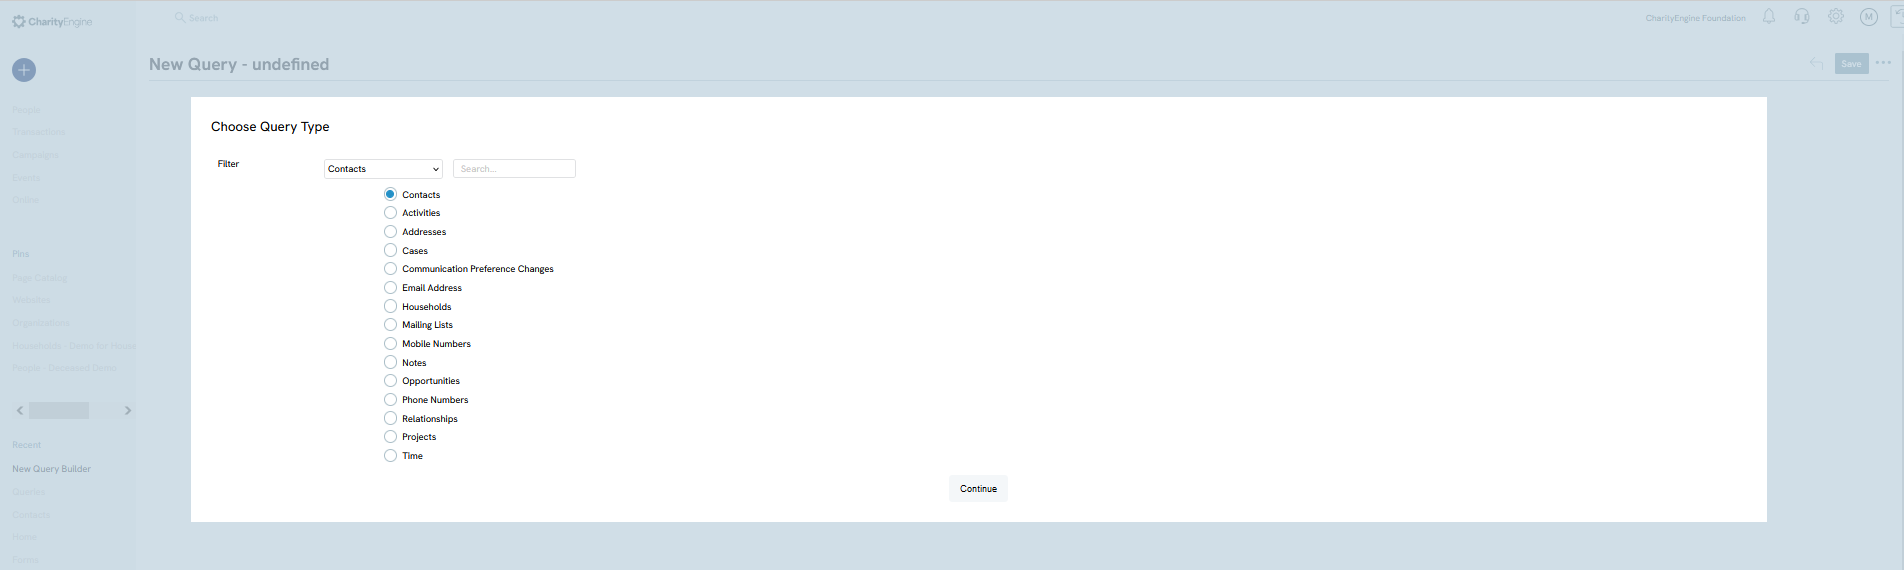
The CharityEngine query tool is structured to provide the user with query capabilities first based upon the Module (i.e. the Contacts database, Donations database, Campaigns database, etc.). Once you have selected the Module, you will then select the specific Table to be queried against (i.e. in this example we are leveraging the Module: Contacts and will query against the Table: Contacts.
The CharityEngine Query tool allows users to select key data points, create complex filtering options, and set groupings and filters to achieve more complex reporting needs.
Overview - Dashboards
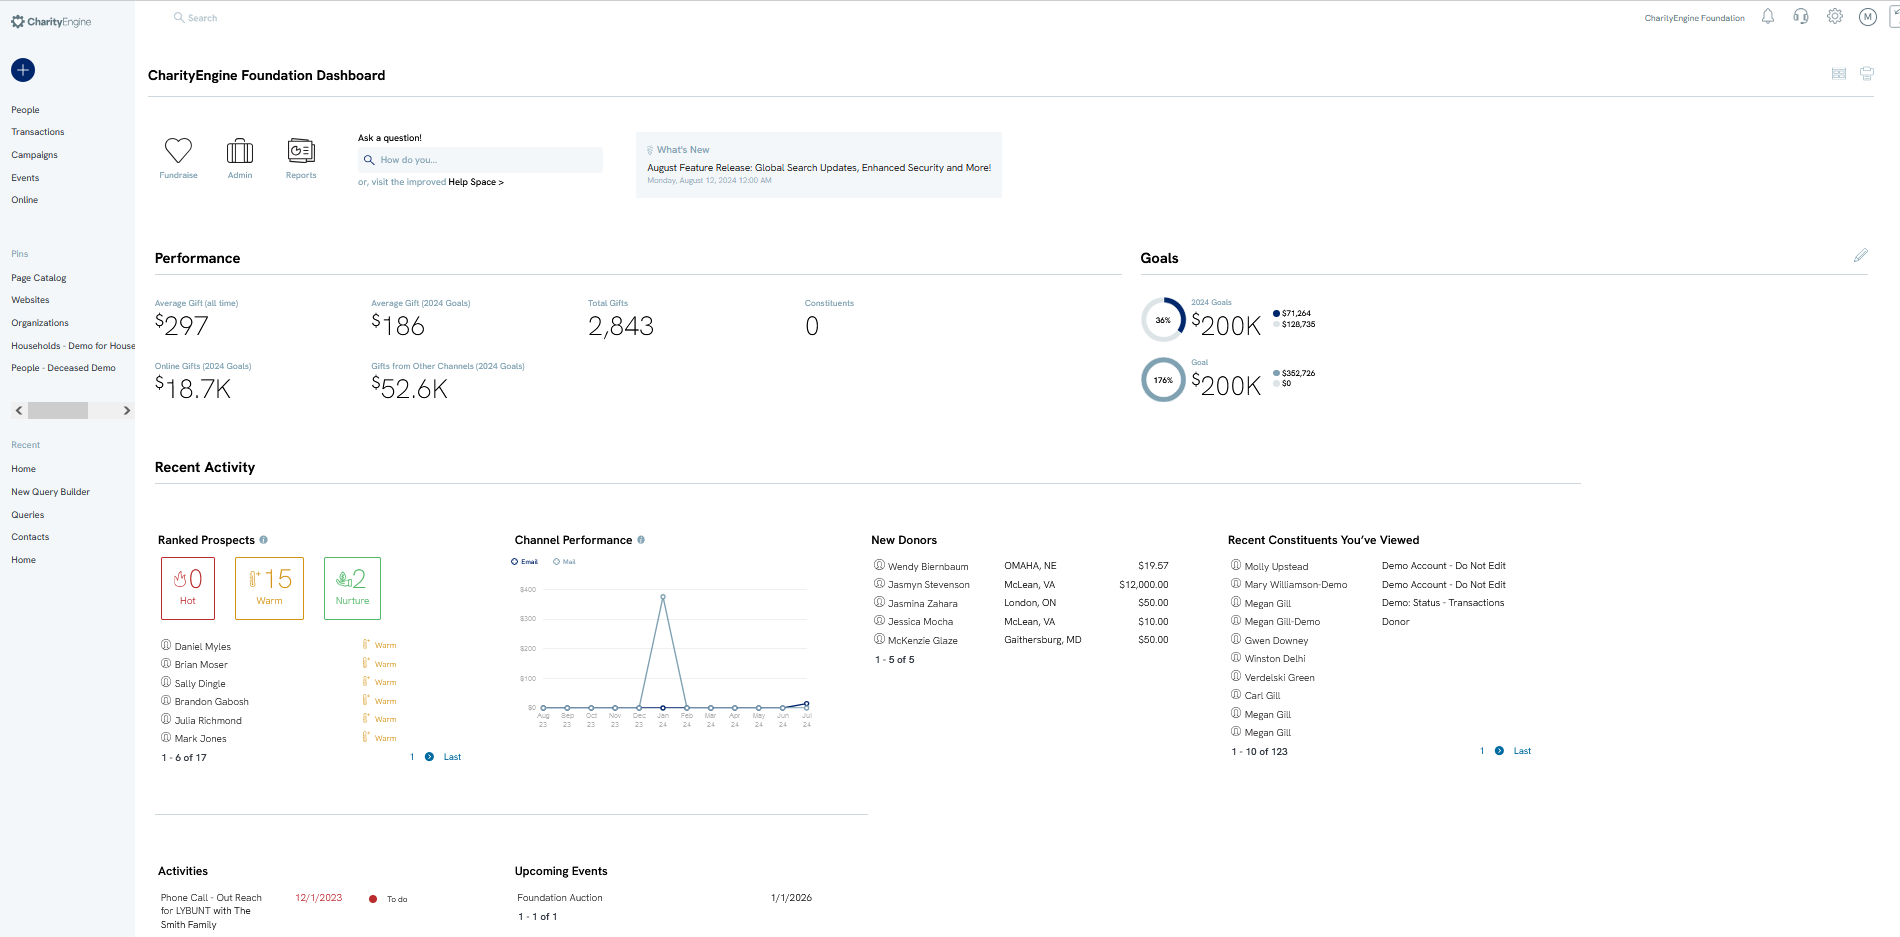
CharityEngine offers a few out of the box dashboards available to you for quick review and access to key data. Upon logging into CharityEngine, you will be directed to your organizational dashboard (standard out of the box). In the top right-hand corner, next to the Printer Icon  , click on the 4 box icon
  to change your dashboard views from the drop down.
If your organization needs to further customize a dashboard, users can easily create dashboard by navigating to the Reports & Analytics App > General > Dashboards to create custom dashboarding views to meet your organizational needs.
In this example, a custom dashboard has been designed leveraging a combination of CharityEngine templates and custom queries to monitor sustainers who may have failed receipt of payment and to identify potential donors who may be candidates for conversion to a monthly sustainer.
FAQs & Additional Reading
Q. I'd like to learn more about the Reports & Analytics out of the box reporting.
A. Check out our article Reports & Analytics: Overview and Usage of the Reports & Analytics Application
Q. I'd like to learn more about the Report Builder functionality.
A. Check out our article Reports & Analytics: How to Use the Report Builder Tool
Q. I'd like to learn more about the Dashboard functionality.
A. Check out our article Reports & Analytics: An introduction to custom dashboards within CharityEngine
Q. I'd like to learn more about the Query functionality.
A. Check out our article Automation & Workflow: An Introduction to Queries
Q. Why are my giving totals not populating on my main dashboard? Why don't we have a Goal set?
A. Values for gift history is driven by the presence of an organizational goal. This value can be set by accessing the Configuration App > General > Goals > Current Period